To monitor a process variable over time, distinguish between common cause (inherent) variation and special cause (assignable) variation, and determine if a process is in a state of statistical control.
- Méthodologies : Clients et marketing, Idéation, Conception de Produits
Control Charts
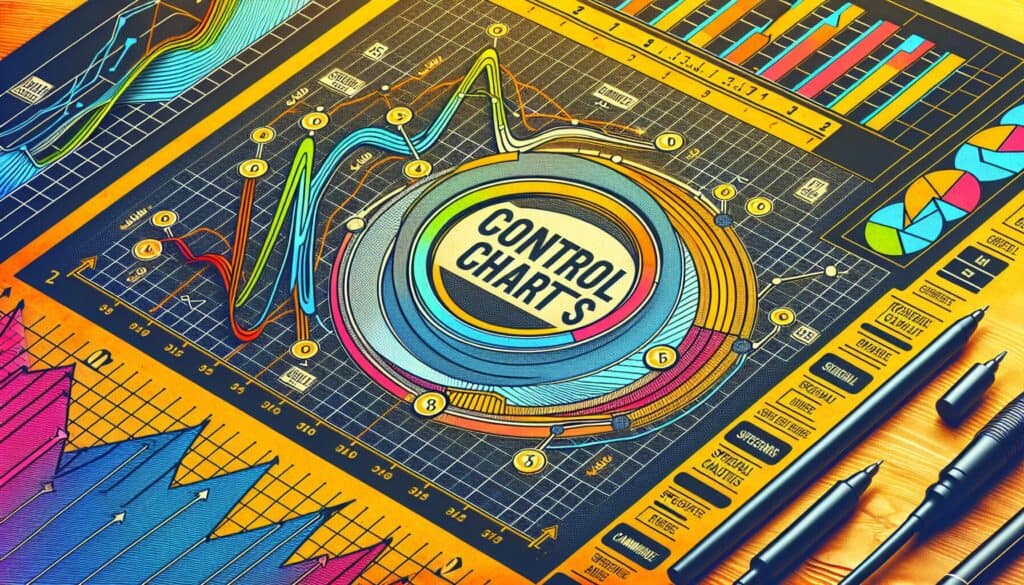
Control Charts
- Amélioration continue, Carte de contrôle, Mesure corrective, Capacité de traitement, Amélioration des processus, Contrôle de qualité, Gestion de la qualité, Contrôle statistique des processus (CSP)
Objectif :
Comment il est utilisé :
- Data points representing a process characteristic are plotted in time order. The chart includes a center line (average), upper control limit (UCL), and lower control limit (LCL). Points falling outside the limits or showing non-random patterns indicate special cause variation.
Avantages
- Provides a visual tool for monitoring process stability and capability; Helps identify when corrective action is needed (special causes) versus when it's not (common causes); Can predict future performance des processus if stable.
Inconvénients
- Requires understanding of statistical principles; Can be misapplied or misinterpreted without proper training; Does not identify the root cause of special variations on its own; Data collection can be time-consuming for some processes.
Catégories :
- Lean Sigma, Fabrication, Qualité
Idéal pour :
- Monitoring and controlling processes to ensure they are stable, predictable, and operating within desired limits.
Control charts find extensive applications in industries like manufacturing, healthcare, and service sectors, particularly during the quality control phase of production or operational processes. For instance, in a manufacturing setting, control charts might be utilized to monitor the dimensions of a part being produced to ensure they remain within specified tolerances, allowing for timely interventions if measurement points deviate from the established limits. In healthcare, control charts could track patient wait times in an emergency department, ensuring that service levels remain within acceptable thresholds. Participants in the implementation of control charts typically include quality control engineers, process managers, and data analysts who collaborate to set relevant parameters, facilitate training, and interpret the resulting data. When applied effectively, this methodology extends beyond merely detecting issues; it can also enhance predictive maintenance strategies by analyzing trends over time, leading to proactive adjustments before variations impact quality. Engaging everyone from frontline workers to management in interpreting and acting on the control chart data can cultivate a culture of continuous improvement within the organization, ultimately influencing overall performance and customer satisfaction.
Principales étapes de cette méthodologie
- Calculate the process average and determine the control limits based on data variability.
- Plot the data points in time order on the control chart.
- Draw the center line (average), upper control limit (UCL), and lower control limit (LCL) on the chart.
- Analyze the plotted points against the control limits for trends and patterns.
- Identify and investigate any points outside the control limits for special causes.
- Determine if corrective actions are necessary based on the analysis of the points.
- Review the process regularly to ensure ongoing stability and control.
Conseils de pro
- Regularly review and recalibrate control limits as process conditions change or as additional data becomes available to ensure accuracy.
- Incorporate automated monitoring systems that alert teams instantly to deviations, enhancing response times and reducing manual oversight efforts.
- Utilize subgrouping techniques in data collection to improve sensitivity in detecting shifts and trends that may not be apparent in individual readings.
Lire et comparer plusieurs méthodologies, nous recommandons le
> Référentiel méthodologique étendu <
ainsi que plus de 400 autres méthodologies.
Vos commentaires sur cette méthodologie ou des informations supplémentaires sont les bienvenus sur le site web de la Commission européenne. section des commentaires ci-dessous ↓ , ainsi que toute idée ou lien en rapport avec l'ingénierie.
Contexte historique


1962
1970
1972
1980
1980
1986
1986
1960
1963
1970
1980
1980
1980
1986
1987


(si la date est inconnue ou n'est pas pertinente, par exemple "mécanique des fluides", une estimation arrondie de son émergence notable est fournie)
Articles Similaires
Questionnaires sur les troubles musculo-squelettiques
Tests à plusieurs variables (MVT)
Analyse de régression multiple
Systèmes de capture de mouvement
Méthode MoSCoW
Test de la médiane de Mood