Product Design, Manufacturing & Innovation Resources
Hogar » Herramientas en línea » Costo de la herramienta de desconexión de Internet (COSTO)

Costo de la herramienta de desconexión de Internet (COSTO)

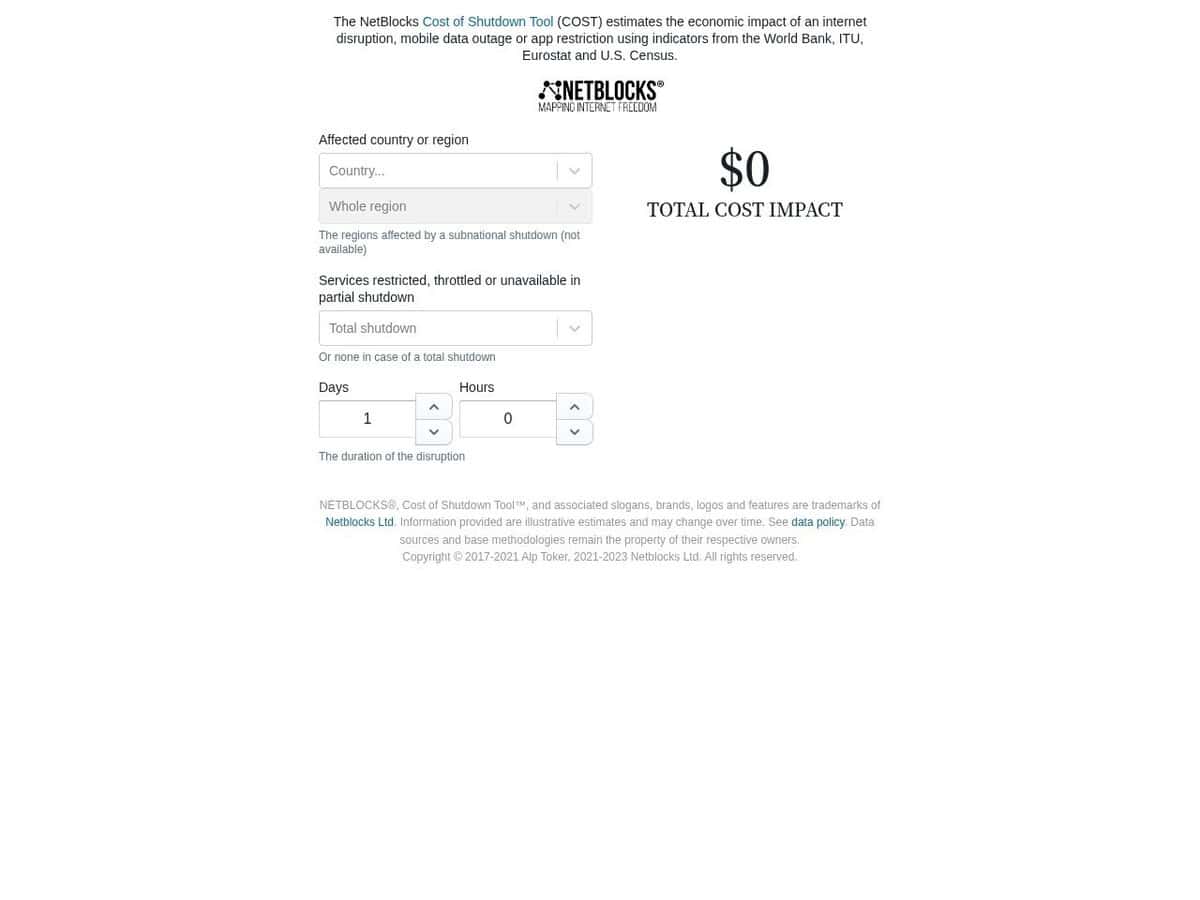
La herramienta COST (Cost of Shutdown Tool) de NetBlocks es un servicio analítico basado en datos que estima el impacto económico de las interrupciones de internet, incluidos los apagones totales, las interrupciones de datos móviles y las restricciones en las redes sociales.

By integrating public economic indicators from the World Bank, ITU, and Eurostat with methodologies from the Brookings Institution and CIPESA, the platform generates financial loss projections based on geographic region, disruption type, and duration. It provides a quantitative framework for documenting how digital governance decisions affect national GDP and the broader digital economy.

Consejo: calcular directamente el valor para cualquier país, basándose en el/los servicio(s) que se cerrarían, es una curiosidad interesante; ver la metodología elegida y la hipótesis económica que la respalda lo es aún más.
Disciplinas: Periodismo, Economía, Derechos Humanos, Telecomunicaciones, Políticas Públicas.
Alternativa gratuita a Top10VPN Coste de los cierres.
Cost of Internet Shutdown Tool (COST) compared with Top10VPN Cost of Shutdowns
Costo de la herramienta de desconexión de Internet (COSTO)Top10VPN Cost of Shutdowns
Type of resource: NetBlocks COST is the estimation tool that Top10VPN applies to shutdowns once their scope and duration are confirmed. It targets total blackouts, mobile data outages and social media restrictions.Type of resource: Top10VPN publishes an annual report on major government-imposed shutdowns, covering 2019 to 2025, with continuous monitoring. It does not offer its own calculator and links to the NetBlocks tool instead.
Método y datos de entrada: Economic indicators come from the World Bank, ITU and Eurostat, and the approach follows the Brookings Institution. For Sub-Saharan Africa, Top10VPN adds the CIPESA model on top of the NetBlocks and Brookings method.Método y datos de entrada: Partial outages are scaled by the affected country market share of internet users, and regional costs by each region share of national GDP. Throttling is classed by functional impact. The page names its tools and inputs but publishes no explicit formulas.
Coverage and results: The 2025 figures list 212 major outages in 28 countries, 120,095 hours, 798.12 million people affected and an estimated 19.7 billion US dollars of cost. Social media shutdowns lasting more than 365 days are excluded, unless access is restored within the year.
Access and updates: The reports are free to read, with one page for each year from 2019 to 2024. The 2025 edition was updated on 5 January 2026, and an incident-level data sheet is published in Google Sheets.

Más OSINT herramientas

Sugiera su mejor herramienta en línea:

¿Conoce algún sitio web mejor, complementario o sustituto del mencionado anteriormente?

> Sugerirlo aquí <

décimo año aniversario

Las imágenes en tamaño completo y las descargas solo están disponibles, de forma totalmente gratuita, para los miembros registrados.

> Acceso <