A tool for identifying the root causes of a problem.
- Methodologien: Wirtschaft, Lean Sigma, Herstellung, Problemlösung, Qualität
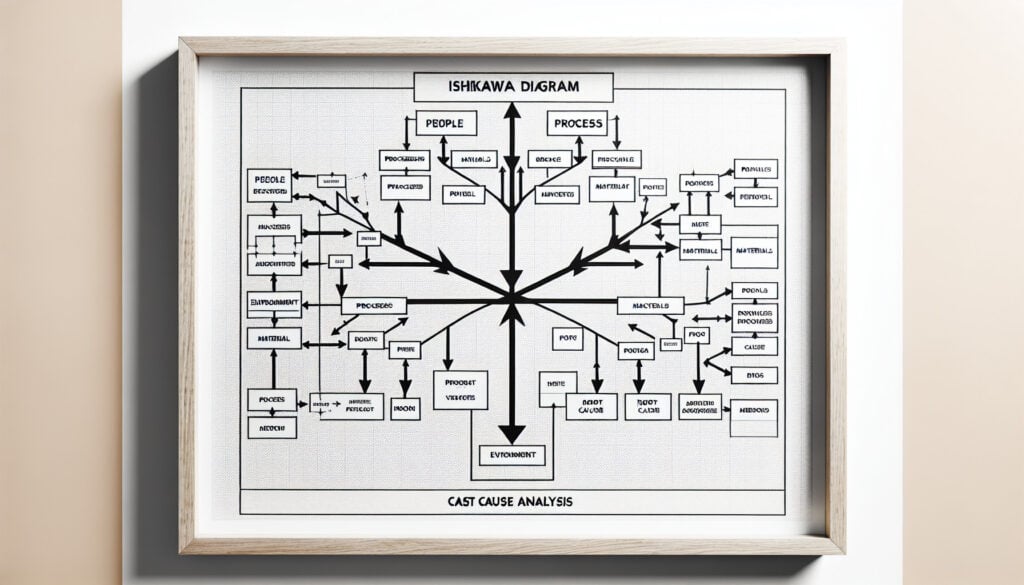
Ishakawa Diagram
Ishakawa Diagram
- Brainstorming, Kontinuierliche Verbesserung, Schlanke Fertigung, Problemlösungs-Techniken, Prozessverbesserung, Qualitätsmanagement, Ursachenanalyse, Sechs Sigma
Zielsetzung:
Wie es verwendet wird:
- Also known as a fishbone diagram or cause-and-effect diagram, it is a visualization tool for categorizing the potential causes of a problem in order to identify its root causes. The causes are typically grouped into major categories, such as people, methods, machines, materials, measurements, and environment.
Vorteile
- Simple and easy to understand; Helps to identify the root causes of a problem and not just the symptoms.
Nachteile
- Can be subjective and depend on the knowledge of the participants; May not be suitable for complex problems with multiple causes.
Kategorien:
- Problemlösung, Qualität
Am besten geeignet für:
- Identifying the root causes of a problem in a team brainstorming session.
The Ishikawa Diagram is widely utilized in various industries such as manufacturing, healthcare, software development, and service sectors, serving as an effective tool during phases of problem-solving or quality improvement initiatives. Typically employed in team brainstorming sessions, this methodology draws participation from diverse stakeholders including engineers, quality assurance personnel, project managers, and frontline employees, enabling a comprehensive examination of issues from multiple angles. Each category within the diagram, such as people, processes, machinery, materials, measurements, and environment, encourages participants to think critically about all potential causes that could contribute to a problem, facilitating a systematic approach to identifying root causes rather than just addressing surface-level symptoms. With its straightforward visual format, the diagram promotes collaborative discussions and enhances understanding among team members, making it easier to communicate complex issues and fostering a shared commitment to developing actionable solutions. Industries often apply this methodology in contexts like Six Sigma projects or Lean initiatives, where continuous improvement is crucial, demonstrating its Vielseitigkeit across different project types and goals. In practice, this tool can lead to more sustainable outcomes by encouraging teams to implement corrective measures that tackle the actual underlying issues rather than simply providing temporary fixes. Engaging in this exercise not only aids in troubleshooting but also strengthens the team’s problem-solving capabilities for future challenges.
Die wichtigsten Schritte dieser Methodik
- Define the problem clearly and concisely.
- Draw the fishbone diagram with a horizontal line and a box at the end for the problem statement.
- Identify main categories of causes and add them as branches off the spine of the diagram.
- Brainstorm potential causes within each category and add them as sub-branches.
- Analyze the most significant causes by discussing their potential impact and likelihood.
- Select the root causes for further investigation or action.
- Develop action plans to address the identified root causes.
Profi-Tipps
- Involve cross-functional teams to bring diverse perspectives, enhancing the depth of analysis and uncovering hidden causes.
- Regularly review and update the diagram as new data emerges, ensuring that it reflects the current understanding of the problem.
- Utilize digital tools for real-time collaboration, allowing team members to contribute insights asynchronously, thus enriching the discussion.
Verschiedene Methoden lesen und vergleichen, Wir empfehlen die
> Umfassendes Methoden-Repository <
zusammen mit den über 400 anderen Methoden.
Ihre Kommentare zu dieser Methodik oder zusätzliche Informationen sind willkommen auf der Kommentarbereich unten ↓ , sowie alle ingenieursbezogenen Ideen oder Links.
Historischer Kontext


1962
1970
1972
1980
1980
1986
1986
1960
1963
1970
1980
1980
1980
1986
1987


(wenn das Datum nicht bekannt oder nicht relevant ist, z. B. "Strömungsmechanik", wird eine gerundete Schätzung des bemerkenswerten Erscheinens angegeben)
Verwandte Artikel
Master Production Schedule (MPS)
Massenanpassung
Marketing-Trichter
Marketing-Audit
MAPO-Index (Bewegung und Unterstützung von Krankenhauspatienten)
Fertigungsressourcenplanung (MRP II)