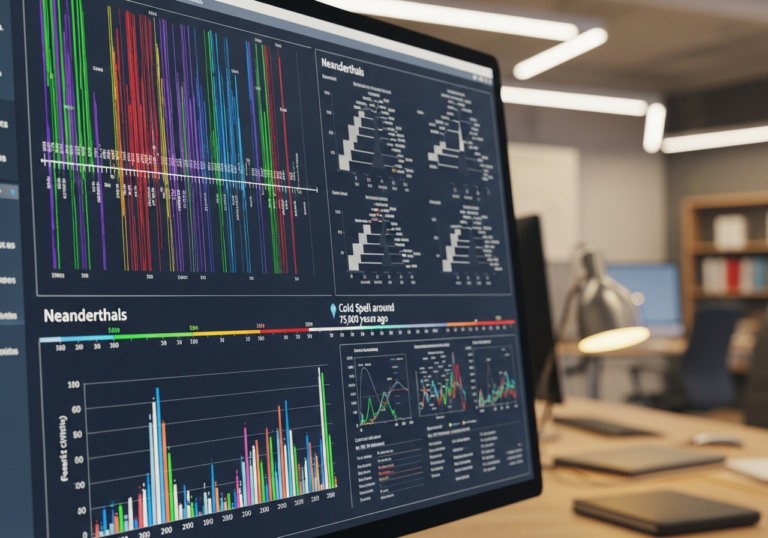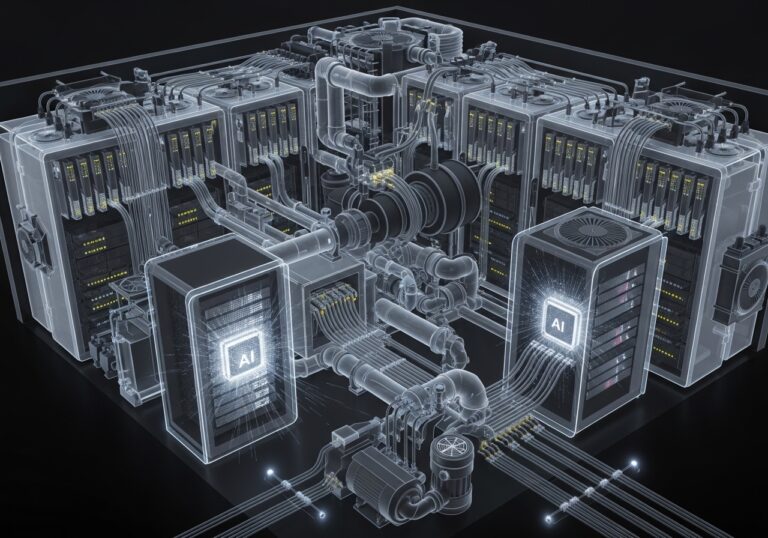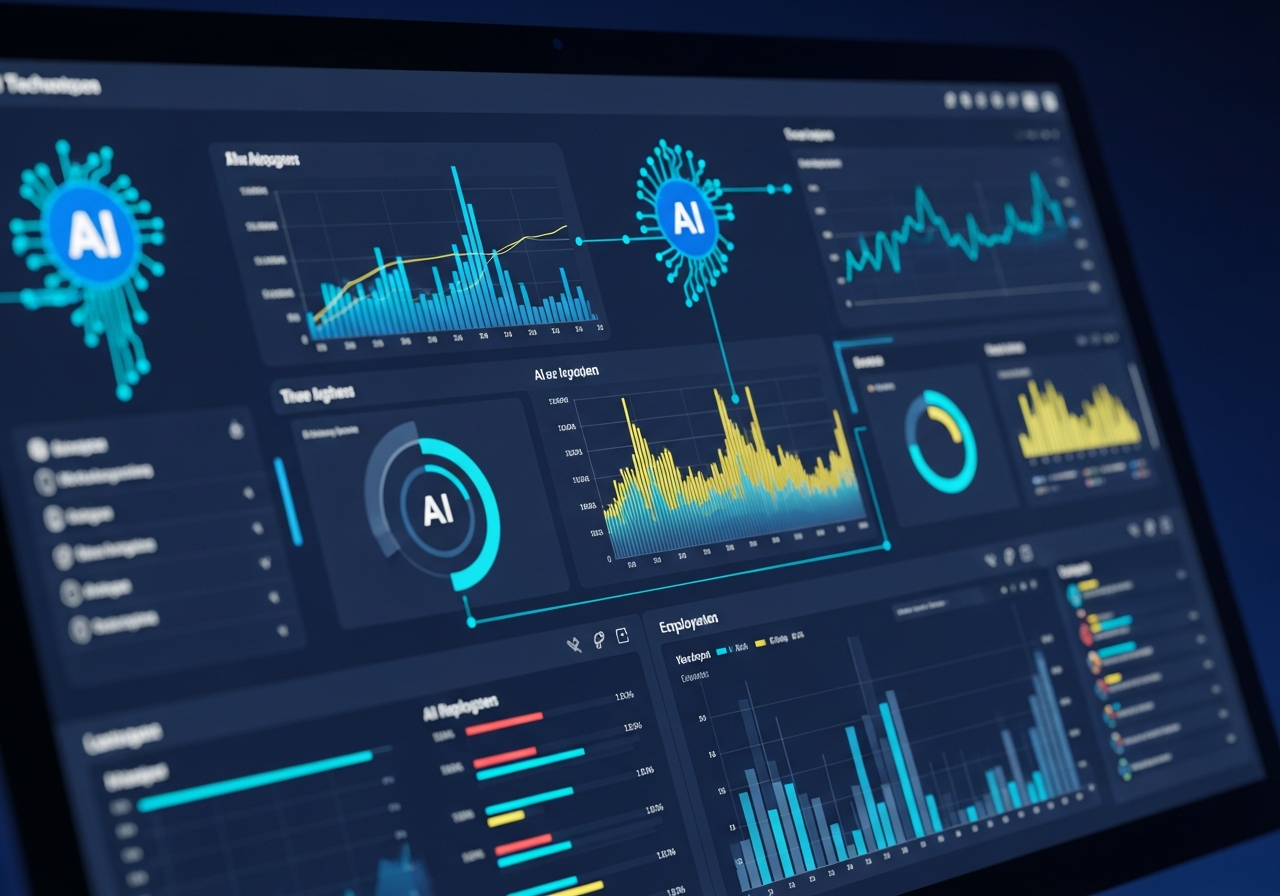
The image displays a computer screen filled with various data visualization widgets. There are multiple graphs and charts representing data trends, including bar charts and line graphs in different colors. Central to the layout is a prominent "AI" label, linked to some of the visual elements. The background is dark, enhancing the vibrancy of the colors used in the graphs and indicators.