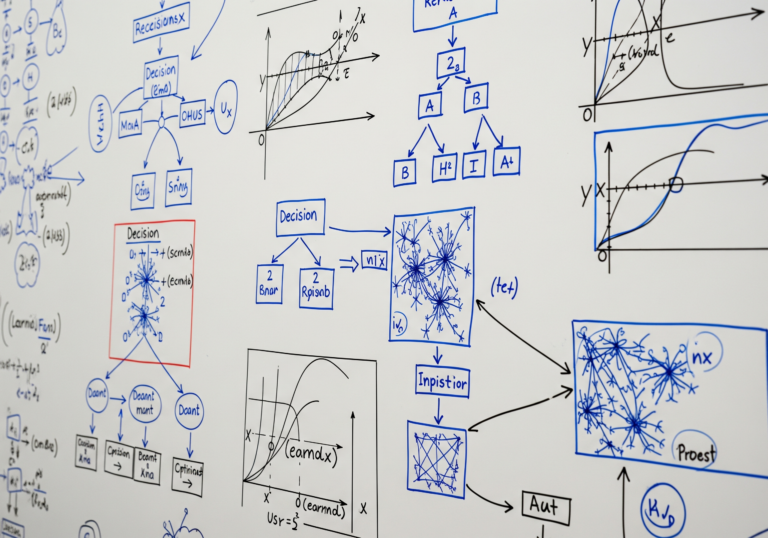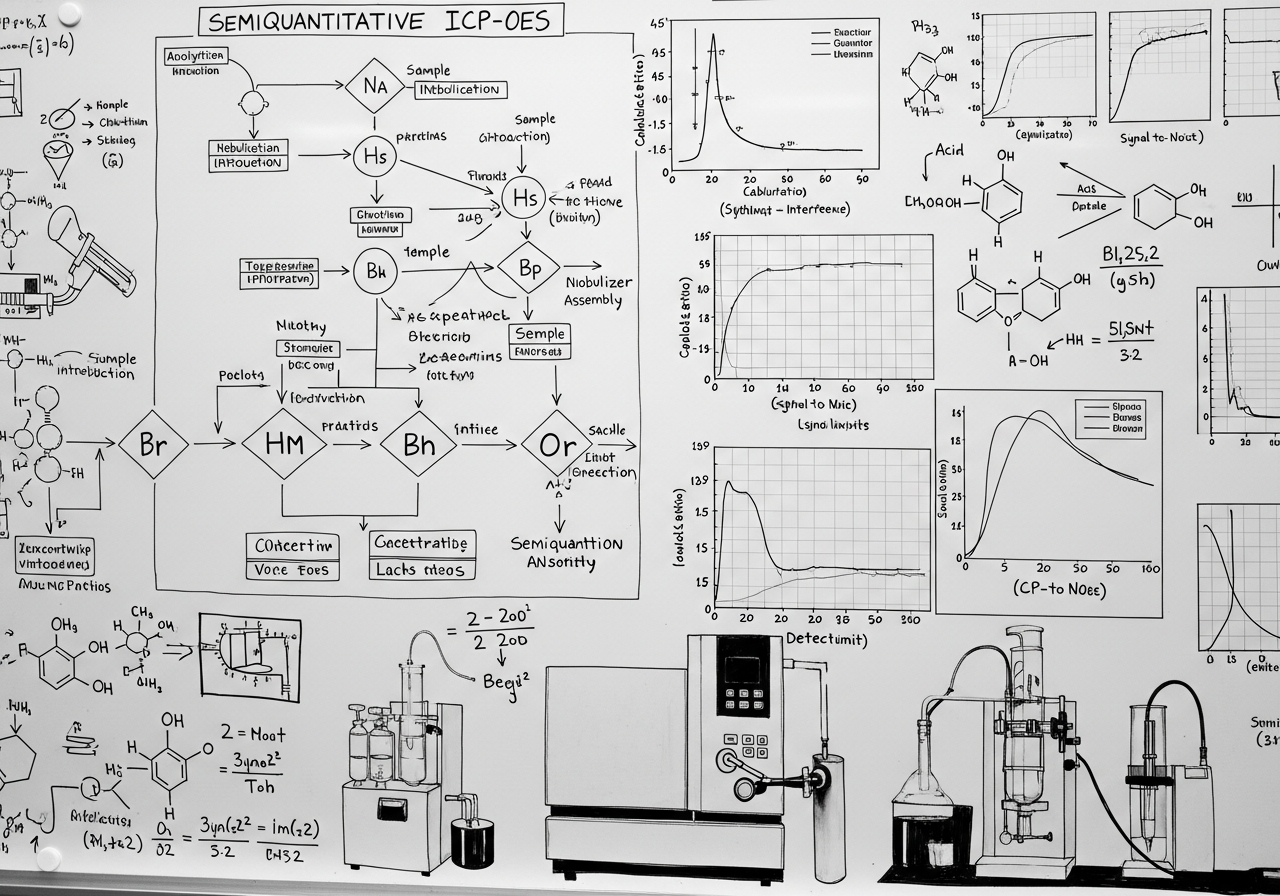
The image shows a large whiteboard filled with diagrams, flowcharts, and graphs related to semiquantitative ICP-OES analysis. Various chemical structures and symbols are illustrated alongside a process flow that includes steps like sample preparation and analysis. There are images of laboratory equipment, including a system for sample introduction and a nebulizer. Multiple charts display data trends and calibration curves, indicating various parameters used in the analytical process.