Product Design, Manufacturing & Innovation Resources

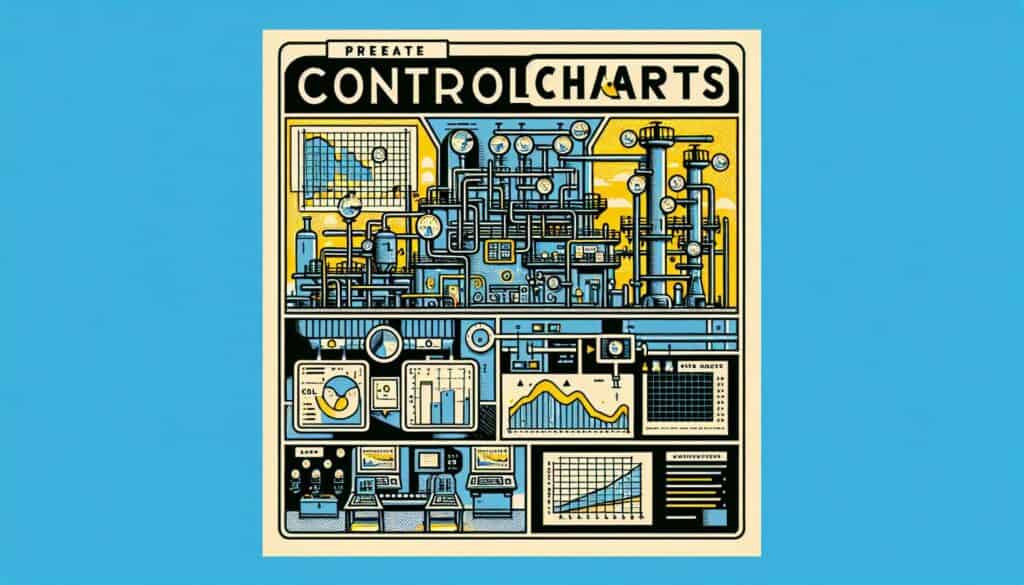
사전 관리도

관리도

사전 관리도

목적:

불량품 생산을 방지하기 위해, 가동 시작 시와 가동 중에 공정 설정을 모니터링하고, 관리도보다 넓은 영역을 사용합니다.

사용 방법:

장점

단점

카테고리:

다음과 같은 경우에 가장 적합합니다:

Pre-Control Charts serve as an effective tool for quality management and can be particularly advantageous in industries such as automotive, electronics, textiles, and food processing, where production often involves a significant number of distinct parts produced in short runs. This methodology is often utilized during the manufacturing phase, particularly in environments where rapid adjustments are necessary due to fluctuations in production or when implementing new processes. Operators and front-line workers, who are familiar with the production intricacies, typically initiate this approach, allowing for prompt decision-making based on real-time data. The simplicity of Pre-Control Charts makes them accessible for users without advanced statistical training, providing immediate visual cues through a straightforward color-coded system that delineates acceptable and unacceptable performance. This enables teams to engage more actively in the monitoring process, fostering a culture of defect prevention rather than merely waiting for issues to be identified through more extensive statistical process control (SPC) mechanisms. Since the methodology requires less rigorous data collection, it allows companies to allocate resources efficiently, minimizing downtime and increasing responsiveness to quality issues. Furthermore, firms may find that integrating Pre-Control Charts into their workflows not only improves process reliability but also enhances the overall skill set of their workforce, empowering operators to take ownership of quality outcomes while effectively collaborating across departments for continuous improvement initiatives.

이 방법론의 주요 단계

  1. 제품의 사양 한계를 정의하십시오.
  2. 검사할 연속 부품의 수를 결정하십시오.
  3. 각 부품을 정해진 기준에 따라 검사하십시오.
  4. 사양에 따라 결과를 녹색, 노란색 또는 빨간색 영역으로 분류합니다.
  5. 부품이 황색 또는 적색 구역에 해당하면 즉시 조정을 시행하십시오.
  6. 공정을 지속적으로 모니터링하고 후속 부품을 검사하십시오.

프로 팁

  • 녹색, 황색, 적색 구역에 대한 명확한 기준을 마련하고, 운영자들이 정의 과정에 참여하도록 하여 책임감을 고취하십시오.
  • 작업자의 참여도와 역량을 유지하기 위해 사전 관리도 판독 및 해석에 대한 정기적인 교육을 실시하십시오.
  • 과거 데이터를 활용하여 현실적인 사양 한계를 설정하고, 검증된 성능 추세를 기반으로 지속적인 조정을 가능하게 합니다.

여러 방법론을 읽고 비교하기 위해, 저희는 다음을 추천합니다

> 광범위한 방법론 저장소  <
400가지가 넘는 다른 방법론들과 함께.

이 방법론에 대한 의견이나 추가 정보는 언제든지 환영합니다. 아래 댓글란 ↓ , 엔지니어링 관련 아이디어나 링크도 마찬가지입니다.

역사적 맥락

1899
1900
1911
1920
1924
1925
1930
1896
1900
1903
1914
1922
1925
1928
1930

(날짜를 알 수 없거나 관련이 없는 경우, 예를 들어 "유체역학"의 경우, 주목할 만한 등장 시기를 대략적으로 추정하여 제공합니다.)

10년차 기념일

고화질 이미지 및 다운로드는 등록된 회원에게만 100% 무료로 제공됩니다.

> 로그인 <