A visual tool used to explore and categorize the potential causes of a specific problem or effect. Also known as a Fishbone or Ishikawa diagram.
- Méthodologies : Gestion de projet
Diagramme de cause à effet
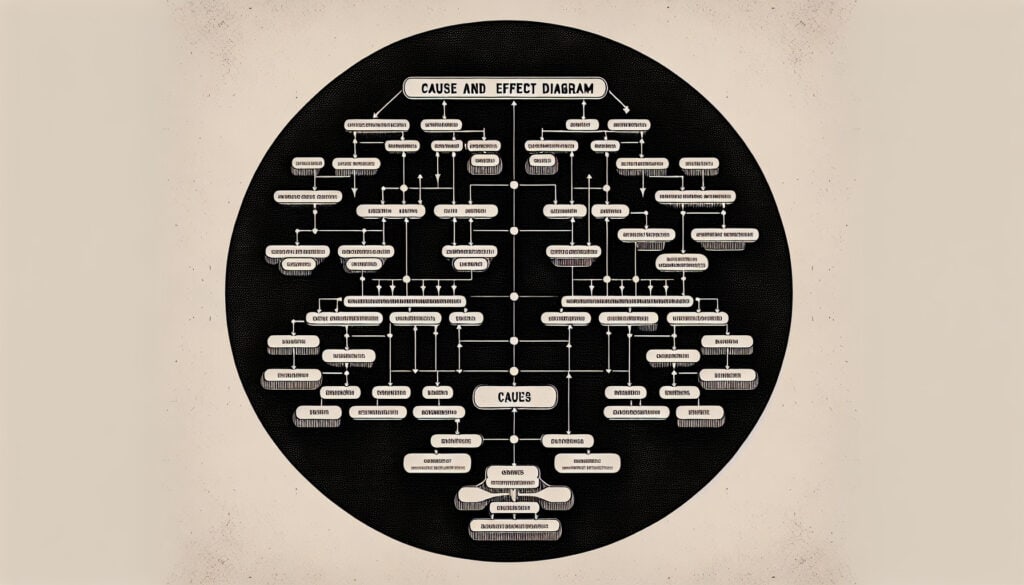
Diagramme de cause à effet
- Remue-méninges, Amélioration continue, Analyse des modes de défaillance et de leurs effets (AMDEC), Techniques de résolution de problèmes, Amélioration des processus, Contrôle de qualité, Gestion de la qualité, Analyse des causes profondes
Objectif :
Comment il est utilisé :
- The problem (effect) is stated at the 'head' of the fish, and the major categories of potential causes (e.g., People, Process, Equipment) are drawn as 'bones', with specific causes brainstormed for each category.
Avantages
- Provides a structured way to brainstorm potential root causes, encourages broad thinking by using standard categories, and creates a clear visual representation of the problem.
Inconvénients
- Can become very complex and cluttered, does not in itself provide a solution or prioritize causes, and the identified causes are potential, not proven.
Catégories :
- Lean Sigma, Fabrication, Résolution de problèmes, Qualité
Idéal pour :
- Systematically brainstorming and categorizing the potential root causes of a problem.
The Cause and Effect Diagram, commonly referred to as a Fishbone Diagram, finds significant applications across various industries, including manufacturing, healthcare, and software development, particularly during project phases focused on root cause analysis and quality improvement. This methodology is utilized during problem-solving sessions to identify and categorize potential causes of a specific issue, where team members from diverse disciplines—such as engineering, design, operations, and quality assurance—collaborate to populate the diagram. In product design, for instance, teams may dissect issues related to product defects by examining categories like materials, processes, and personnel skills, encouraging participants to think broadly within these structured frameworks. In healthcare, use of this diagram can reveal underlying factors contributing to patient care challenges, allowing organizations to enhance service delivery through targeted interventions. Furthermore, through the visual clarity the diagram provides, stakeholders can better communicate findings, prioritize root causes for investigation, and devise comprehensive strategies to tackle complex problems effectively. It is particularly valuable in lean management initiatives where organizations aim to eliminate waste and improve processes, thus fostering a continuous improvement culture that engages all employees in problem-solving activities.
Principales étapes de cette méthodologie
- Identify and clearly state the problem at the head of the diagram.
- Determine major categories of potential causes, such as People, Process, Equipment, and Environment.
- Draw branches for each major category, forming the 'bones' of the diagram.
- Brainstorm specific causes within each major category.
- Encourage team members to contribute ideas, ensuring a comprehensive list of potential causes.
- Organize and refine the list of specific causes, clustering similar ideas together.
- Analyze and prioritize the causes for further investigation or action.
Conseils de pro
- Involve cross-functional team members to capture diverse insights and expertise, increasing the likelihood of identifying all potential causes.
- Use quantitative data to prioritize identified causes based on their impact and likelihood, ensuring a focus on the most pressing issues.
- Iteratively review and refine the diagram through feedback sessions, enhancing clarity and collaboration in the root cause analysis process.
Lire et comparer plusieurs méthodologies, nous recommandons le
> Référentiel méthodologique étendu <
ainsi que plus de 400 autres méthodologies.
Vos commentaires sur cette méthodologie ou des informations supplémentaires sont les bienvenus sur le site web de la Commission européenne. section des commentaires ci-dessous ↓ , ainsi que toute idée ou lien en rapport avec l'ingénierie.
Contexte historique


1962
1970
1972
1980
1980
1986
1986
1960
1963
1970
1980
1980
1980
1986
1987


(si la date est inconnue ou n'est pas pertinente, par exemple "mécanique des fluides", une estimation arrondie de son émergence notable est fournie)
Articles Similaires
Questionnaires sur les troubles musculo-squelettiques
Tests à plusieurs variables (MVT)
Analyse de régression multiple
Systèmes de capture de mouvement
Méthode MoSCoW
Test de la médiane de Mood