将工作空间或流程中的人、材料或信息的实际流动可视化,以识别和减少浪费的运动和运输。
- 方法: 工程, 质量
意面图
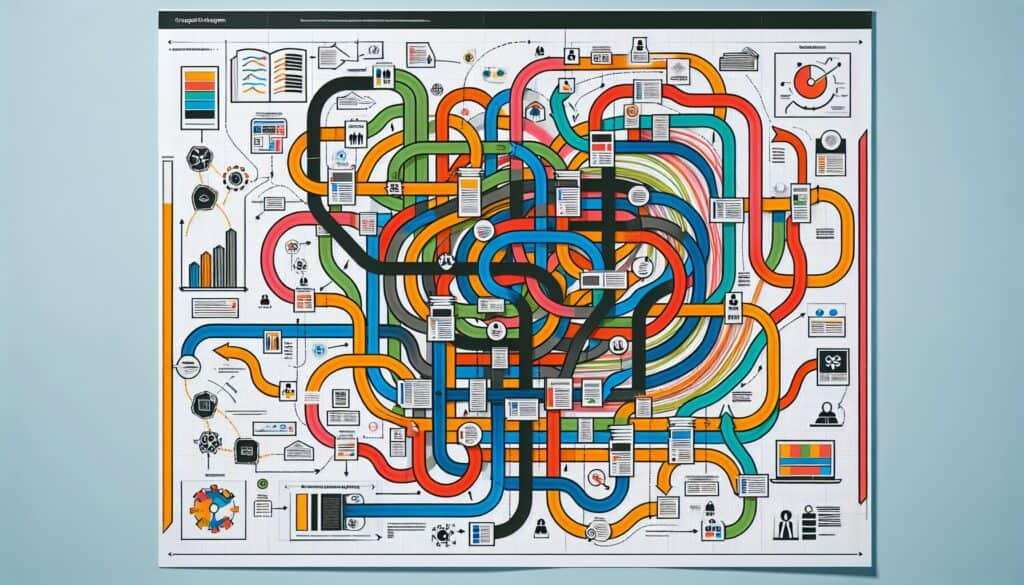
意面图
- 持续改进, 可持续性设计, 效率, 人体工程学, 精益制造, 流程改进, 流程制图, 价值流映射, 减少废物
目标
如何使用
- 平面图或流程图上的连续线图,用于追踪物品或人员的移动路径。由此形成的线条网(类似意大利面条)可以突出显示出效率低下的问题,如行程过长、回溯和不必要的移动。
优点
- 以简单直观的方式识别浪费的运动;促进有关流程低效的交流;帮助设计更高效的布局;让员工参与流程改进。
缺点
- 复杂流程或多个物品/人员的创建可能耗时;主要关注物理移动,可能无法捕捉其他类型的浪费;准确性取决于仔细观察。
类别
- 人体工程学, 精益西格玛, 制造业, 解决问题
最适合:
- 通过直观地绘制产品、材料或人员的移动路径图,识别并消除浪费的移动和运输。
Spaghetti Diagrams are particularly useful in various sectors, such as manufacturing, healthcare, and logistics, where the physical movement of items or personnel is frequent and critical. In manufacturing settings, these diagrams can ensure that assembly lines are designed to minimize the distance traveled by workers and materials, thus enhancing production efficiency. In healthcare, analyzing patient and staff movements through facility spaces can lead to improved layouts that promote better patient care and reduce wait times. During the project planning phase, team members including engineers, project managers, and process improvement specialists can collaborate to create these diagrams, using tools like floor plans or process maps to visualize current workflows. This iterative approach not only identifies bottlenecks and redundancies but also encourages staff to participate actively by sharing their insights on day-to-day operations, which can lead to a sense of ownership over the process improvements. Historically, companies such as 丰田 have effectively utilized Spaghetti Diagrams as part of Lean methodologies to eliminate waste, demonstrating the practical application within Lean Six Sigma frameworks. Adopting this methodology can also be advantageous when exploring new facility designs, as it provides a baseline for measuring the effects of any changes made.
该方法的关键步骤
- Select the area to be analyzed and obtain an accurate floor plan or process map.
- Trace the actual path taken by the item or person within the area.
- Use a continuous line to represent movements, ensuring clarity of the drawn path.
- Look for areas with excessive movement, backtracking, or unnecessary interactions.
- Identify specific locations where processes can be streamlined or redesigned.
- Engage with stakeholders to discuss observed patterns and seek collaborative solutions.
- Consider alternative layouts or processes to minimize wasted motion.
- Implement changes and monitor their effectiveness through further analysis.
专业提示
- Incorporate quantitative metrics alongside the spaghetti diagram to correlate movement efficiencies with performance objectives, providing a data-driven perspective.
- Conduct team workshops to collaboratively create and analyze the spaghetti diagram, ensuring diverse viewpoints contribute to identifying inefficiencies.
- Iterate the layout design based on findings from the spaghetti diagram, using simulation tools to visualize changes before implementation, fostering better decision-making.
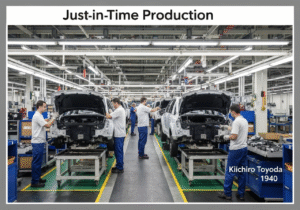
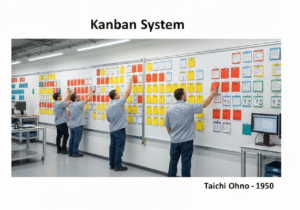
历史背景
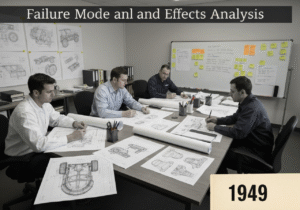


1949
1950
1950
1960
1960
1960
1960
1940
1950
1950
1958
1960
1960
1960
1960


(如果日期不详或不相关,例如 "流体力学",则对其显著出现的时间作了四舍五入的估计)。
相关文章
蒙特卡罗模拟
基于模型的测试
型号检查
混合方法研究
防错(Poka-Yoke)
任务简介测试