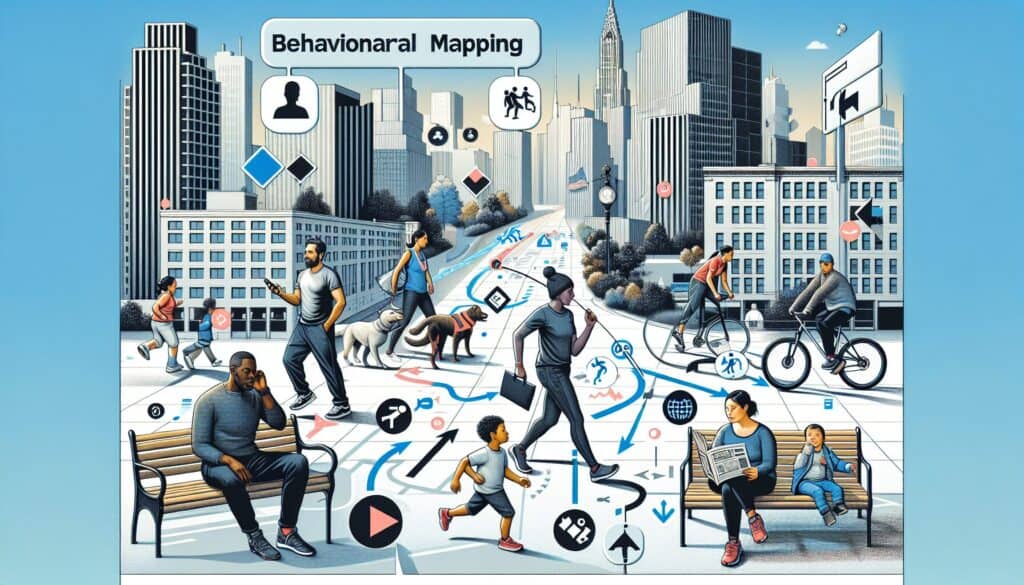
Behavioral mapping is particularly effective in various industries, including retail, urban planning, workplace design, and healthcare, where understanding user behavior can significantly influence design outcomes. For instance, in retail, this methodology allows designers to analyze customer pathways, dwell times, and interaction hotspots within a store, leading companies like Zara or Apple to optimize layouts that enhance customer engagement and increase sales. In urban planning, behavioral mapping can be employed in public spaces to examine how individuals interact with amenities, such as parks or transportation hubs, enabling planners to create environments that encourage social interaction or promote safety. In the context of healthcare facilities, it can highlight how patients navigate through hospitals, providing insights that inform the arrangement of departments to reduce stress and improve operational efficiency. This methodology can be initiated by designers, architects, or behavioral scientists and often involves collaboration with stakeholders, including end-users, to ensure that the mapping accurately captures human behavior. These participants may include focus groups or community members who provide qualitative input that complements the quantitative data collected through observation and logging. Importantly, the objective data generated from behavioral mapping can pinpoint not only areas for improvement but also validate successful design decisions, making it a valuable resource during different project phases, from initial concept development through to post-occupancy evaluation. Analyzing the patterns revealed through behavioral mapping equips teams with the information necessary to create environments that not only meet user needs but also encourage positive interactions and experiences within those spaces.
该方法的关键步骤
专业提示
阅读和比较几种方法、 我们建议
> 广泛的方法论资料库 <
以及其他 400 多种方法。
欢迎您就此方法发表评论或提供更多信息,请登录 下面的评论区 ↓ ,因此任何与工程相关的想法或链接都是如此。