Gráfico de Gantt
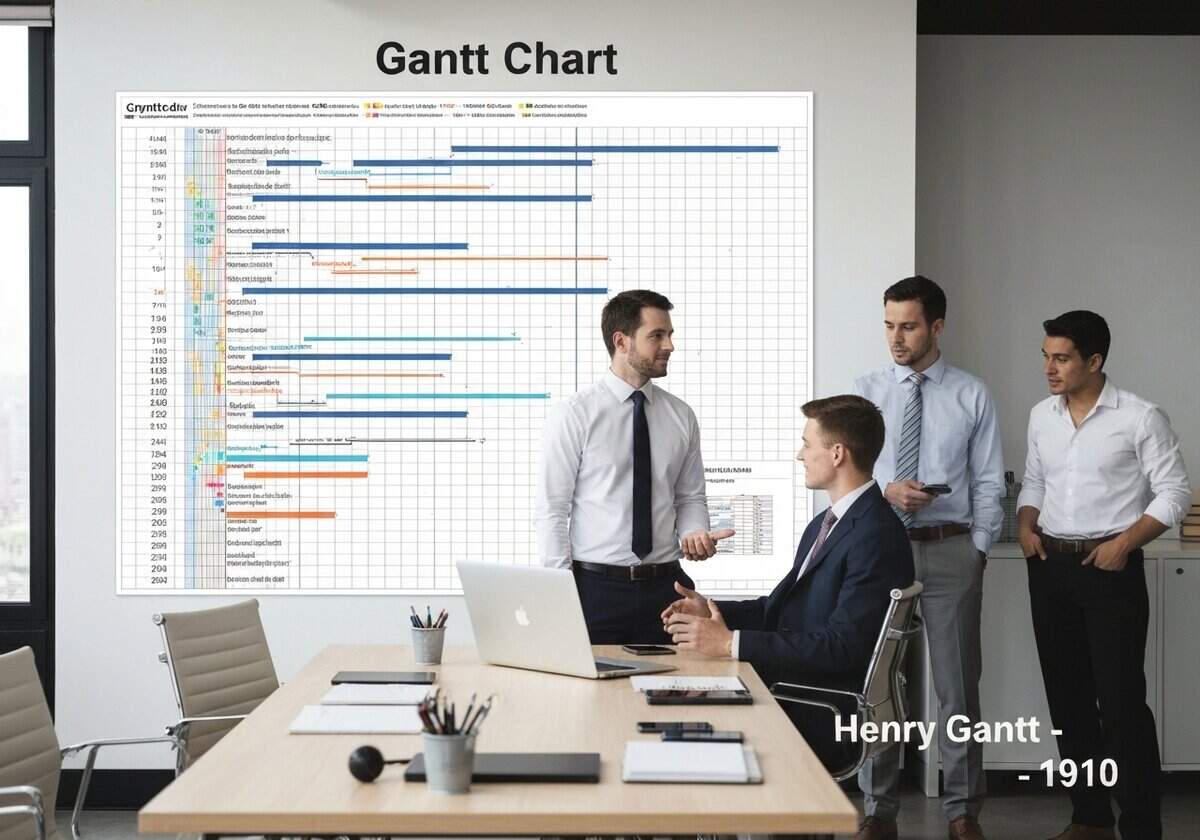
O gráfico de Gantt é um gráfico de barras que ilustra o cronograma de um projeto. Ele lista as tarefas verticalmente e os intervalos de tempo horizontalmente. As barras horizontais mostram as datas de início e término dos elementos do projeto, juntamente com sua duração. O gráfico visualiza as dependências entre as tarefas e acompanha o status atual do cronograma, mostrando qual porcentagem de cada tarefa está concluída.
The Gantt chart, conceived by Henry Gantt around 1910-1915, was a revolutionary tool that departed from abstract lists of tasks. Its primary novelty was the visual representation of time against activity. This graphical display made project schedules intuitive and accessible to managers and workers alike, a significant improvement over previous tabular methods. To construct a Gantt chart, one first lists all necessary tasks on the vertical axis. The horizontal axis represents time, broken down into suitable increments like days, weeks, or months. For each task, a horizontal bar is drawn from its start date to its end date, visually representing its duration and placement in the overall timeline.
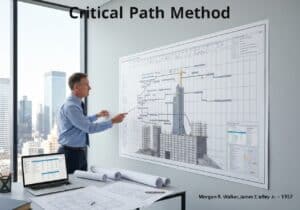
Modern Gantt charts have evolved significantly. They often include milestone markers for important deadlines, dependency lines (e.g., finish-to-start links) showing relationships between tasks, and color-coding for different task types or resource assignments. A key feature is progress tracking, often shown by shading a portion of a task’s bar to represent the percentage of work completed. While highly effective for visualizing schedules, traditional Gantt charts have limitations. They can become cluttered and difficult to read for highly complex projects with hundreds of tasks. They also do not inherently display the ‘critical path’—the sequence of tasks that determines the project’s total duration—without being combined with techniques like PERT or CPM. Despite this, the Gantt chart remains a cornerstone of project management, with its principles integrated into virtually all modern project management software like Microsoft Project, Asana, and Trello.
UNESCO Nomenclature: 5312
Ciências da gestão
Precursores
- Karol Adamiecki’s ‘harmonogram’ (1896)
- Early forms of progress charts used in engineering
- Frederick Taylor’s principles of scientific management
Aplicações
- construction project planning
- software development roadmaps
- event management timelines
- manufacturing production schedules
- marketing campaign management
- research project planning
Ideias de Inovação Potencial
Devido ao tráfego de bots de coleta de dados, atualmente superior a 40 mil por dia, este conteúdo é reservado aos membros da comunidade.
> Login < ou > Registrar < (100% gratuito) para acessar isso, assim como todo o restante do conteúdo e das ferramentas restritas.
Related to: Gantt chart, project management, scheduling, timeline, bar chart, task management, Henry Gantt, project planning, dependency, milestone.