간트 차트는 프로젝트 일정을 시각적으로 보여주는 막대 그래프입니다. 세로축에는 작업을, 가로축에는 시간 간격을 나타냅니다. 가로 막대는 프로젝트 요소의 시작일과 종료일, 그리고 기간을 보여줍니다. 이 차트는 작업 간의 의존 관계를 시각화하고 현재 일정 상태를 추적하여 각 작업의 완료율을 보여줍니다.


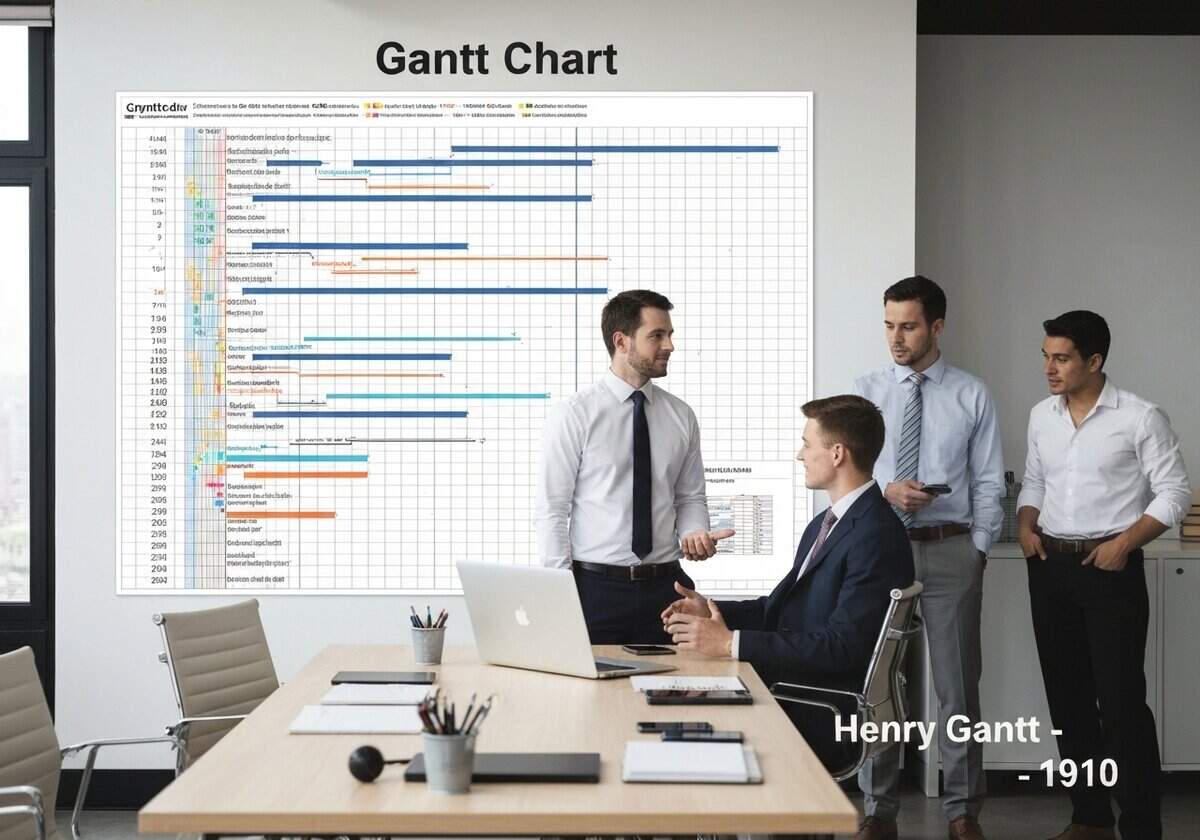
간트 차트
(날짜를 알 수 없거나 관련이 없는 경우, 예를 들어 "유체역학"의 경우, 주목할 만한 등장 시기를 대략적으로 추정하여 제공합니다.)


