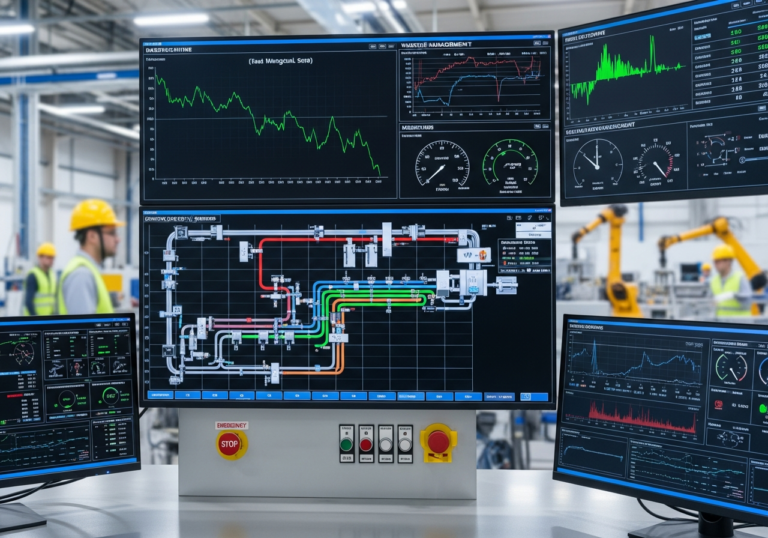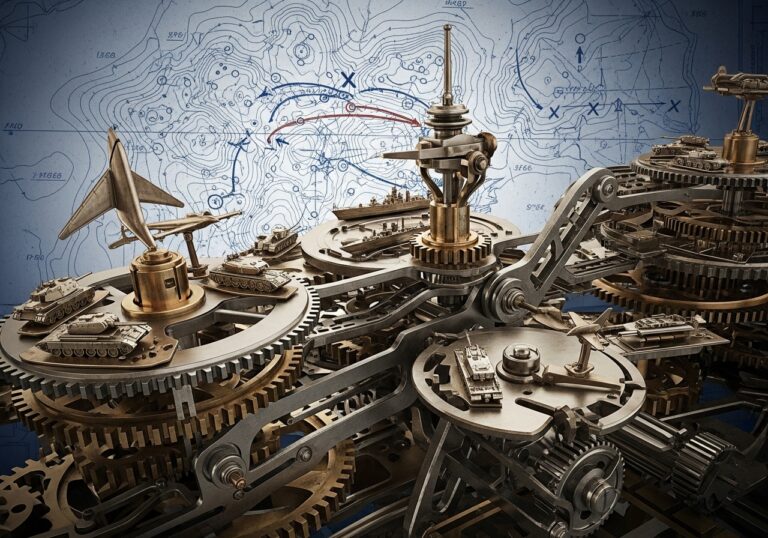
The image displays a graphical representation of manufacturing production data on a map. Various lines in different colors represent production levels over time, with peaks and troughs shown along the axes. Icons such as drones and machinery are marked on the map to indicate specific industrial areas. A live feed is shown in a small window at the top right, depicting an aerial view of a manufacturing facility.