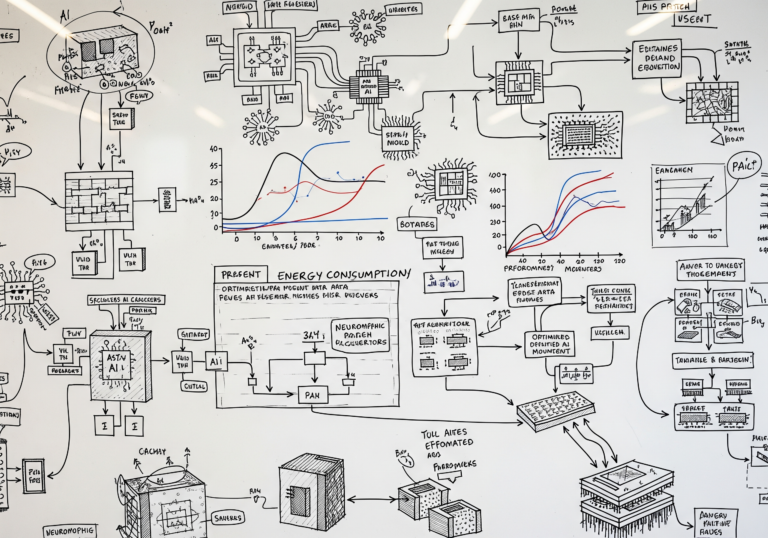
The image features a collection of hand-drawn graphs, flowcharts, and diagrams related to economic concepts, particularly focusing on oil and market trends. One graph shows a downward trajectory labeled "OIL," while another graph titled "MARKET" also displays a downward trend. Various annotations, arrows, and symbols connect different elements, indicating relationships or processes. There are scattered labels and icons, including barrels, which suggest discussions about oil production and market analysis.