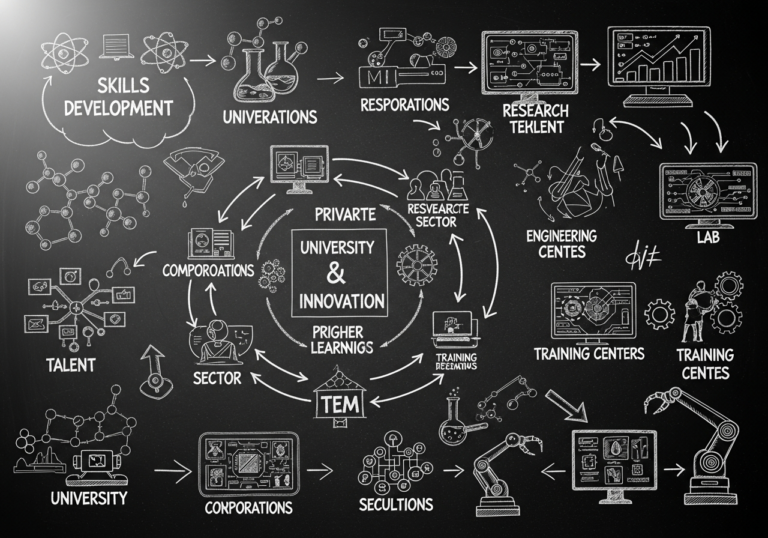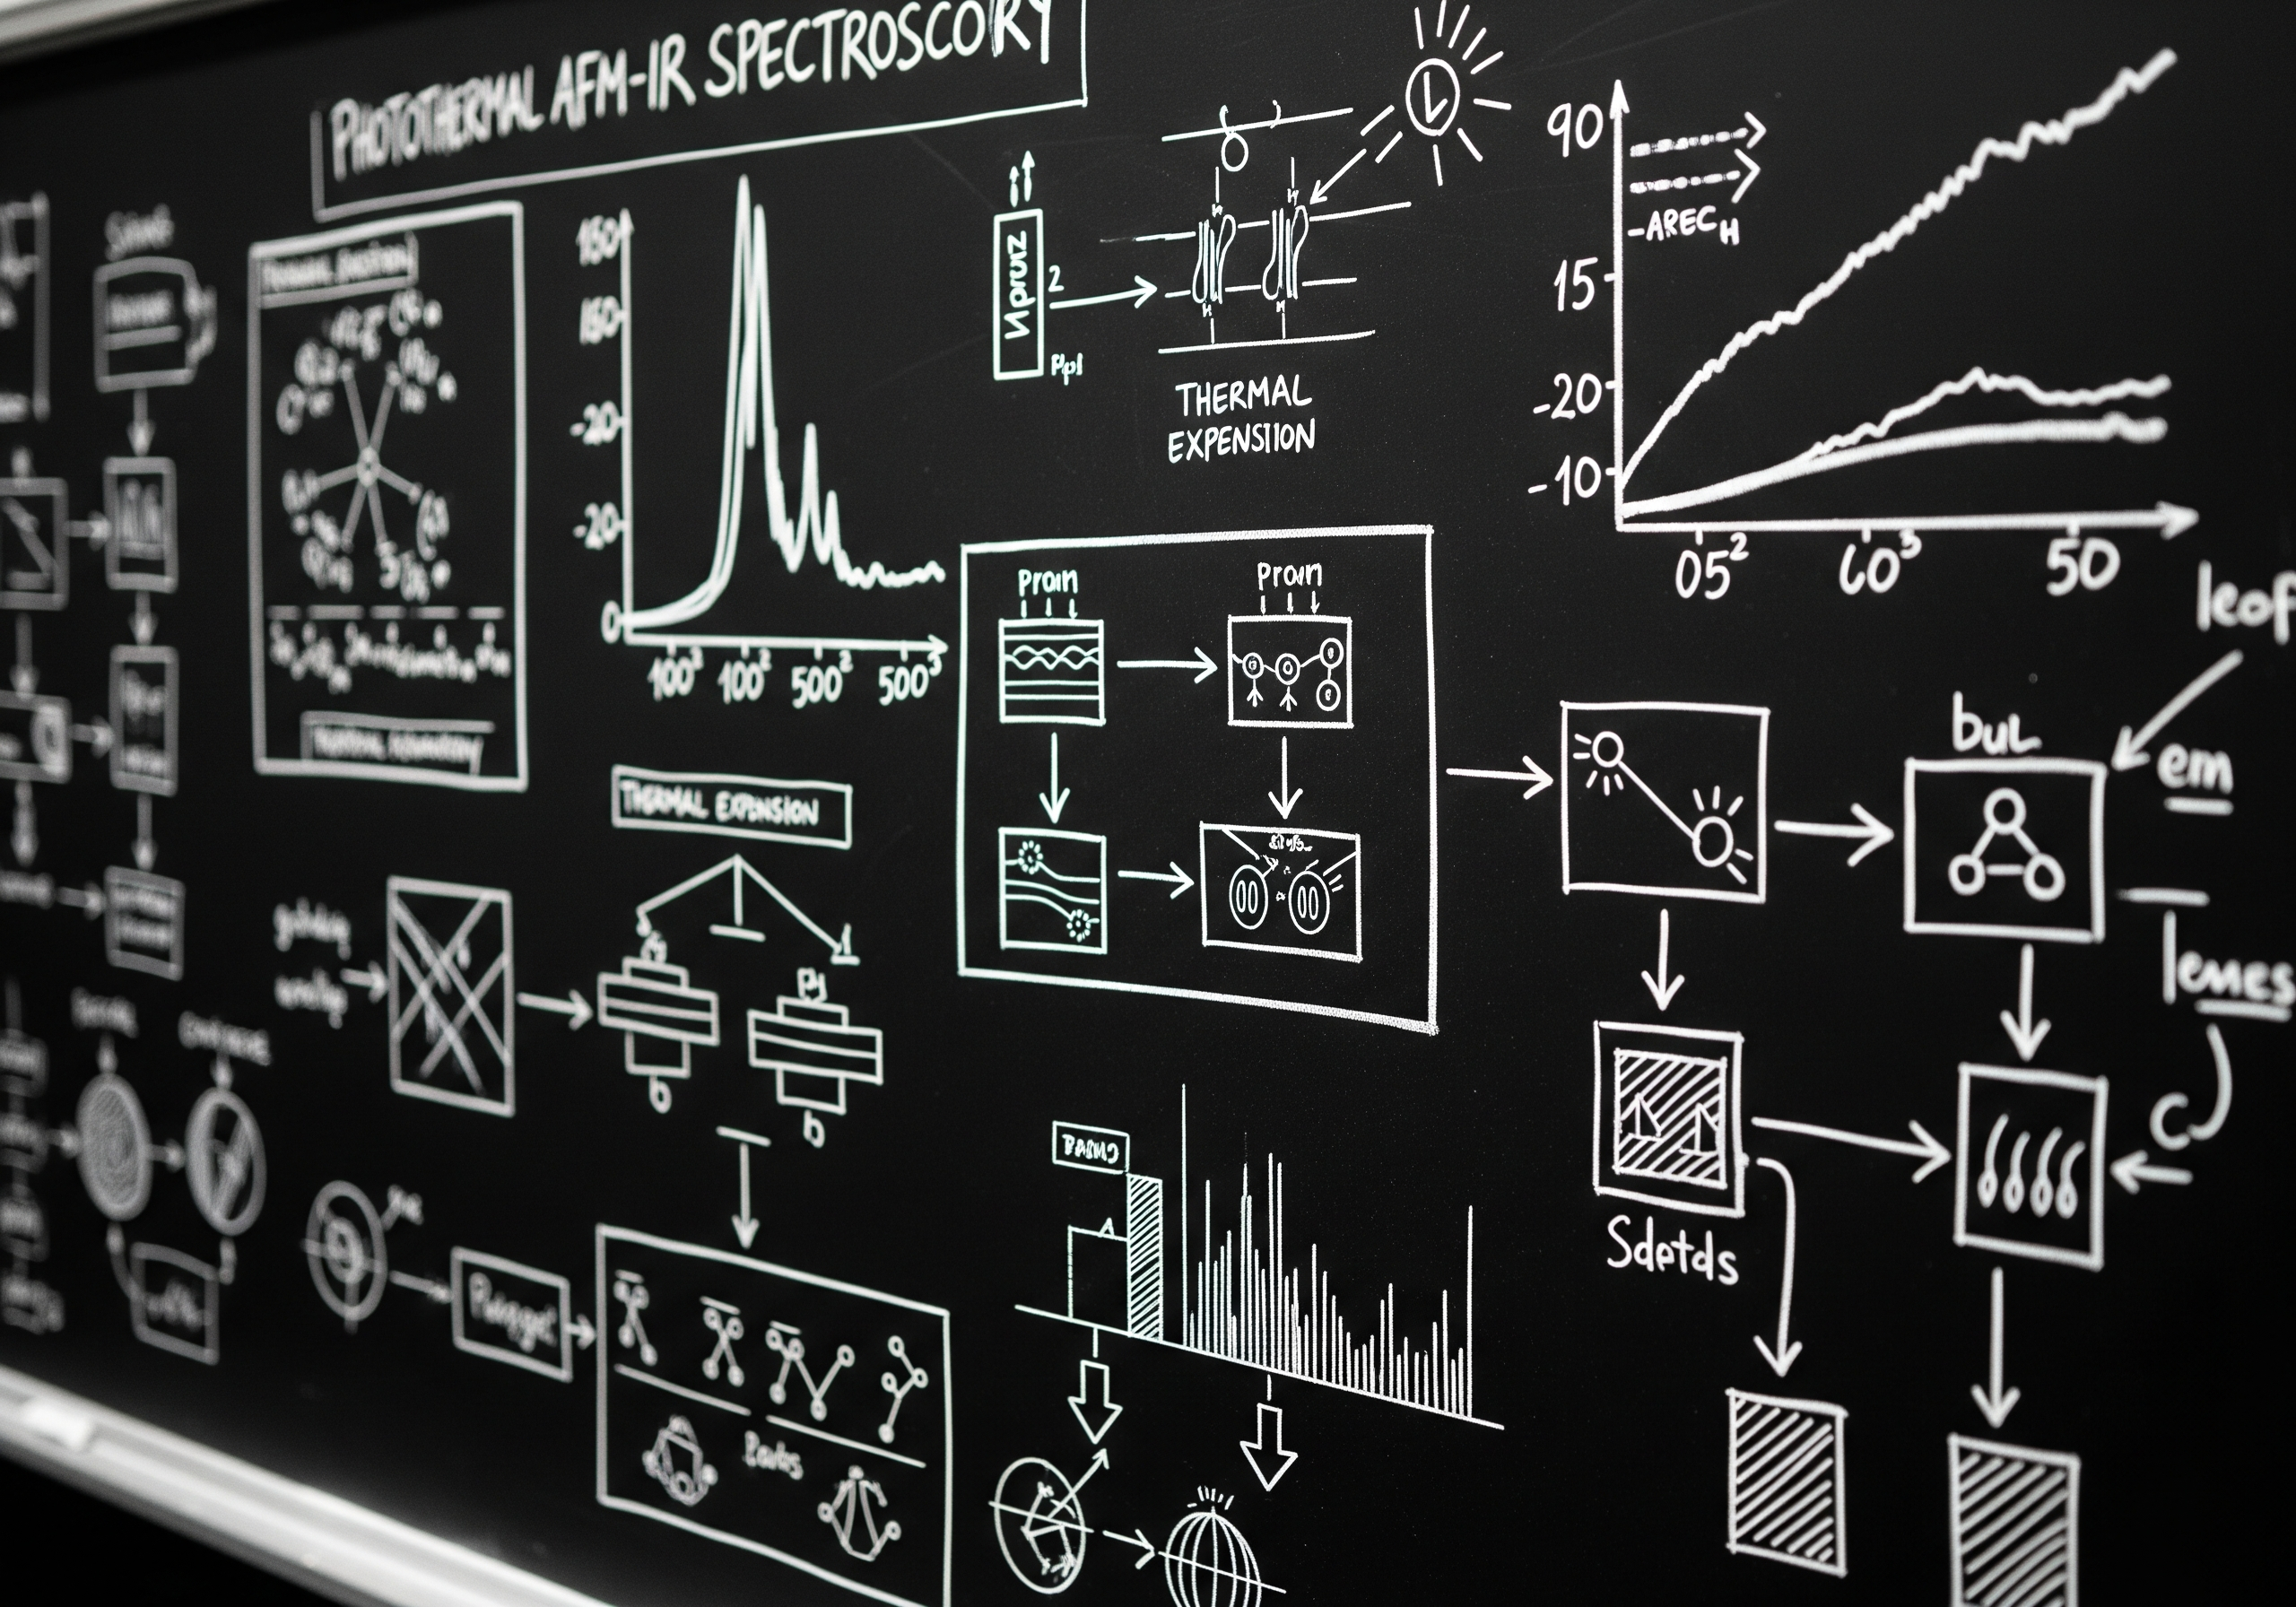
The image shows a dark chalkboard covered in white drawings and text related to "Photothermal AFM-IR Spectroscopy." Various diagrams illustrate processes such as thermal expansion, including graphs with labeled axes. There are flowcharts depicting different steps, including interactions of proteins and their transitions. Statistical data and visual summaries are displayed alongside arrows indicating movement or relationships among concepts.