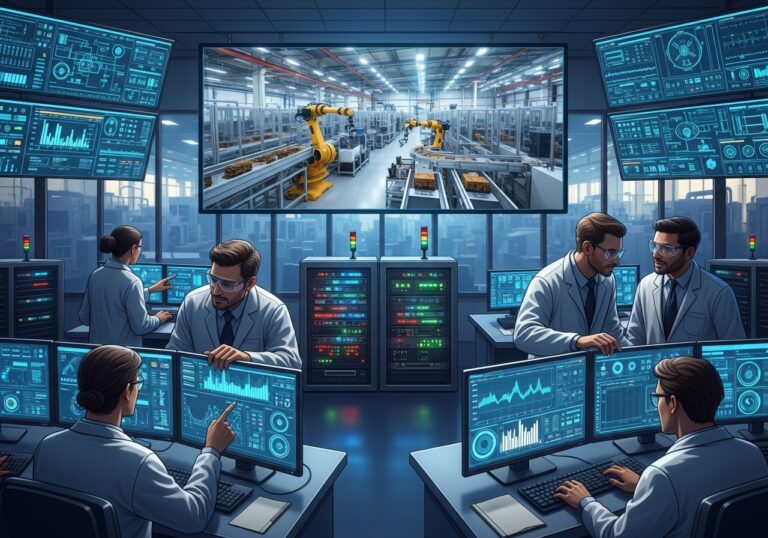
The image shows a computer monitor displaying a software interface. Various graphs and charts are visible, featuring multiple colored lines and peaks indicating data trends. There are panel sections labeled with terms like "Notably Sonority" and "Yoftru," suggesting different data categories. On the left side, there is a menu with options such as "Read," "Holoidas," and "Costs."