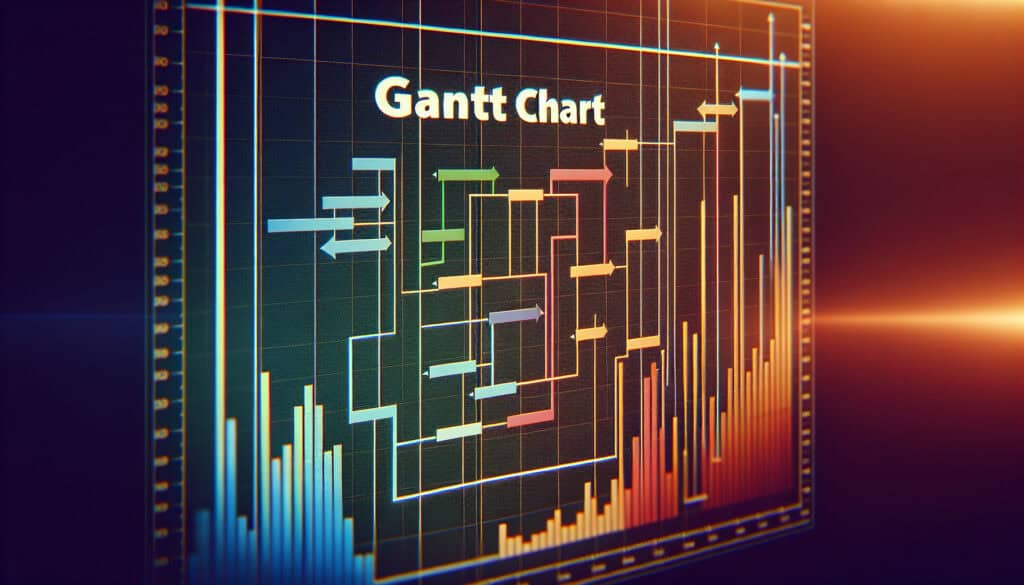
Gantt charts serve as effective tools for visualizing project timelines, particularly in industries such as construction, software development, and research and development, where multiple interconnected tasks are common. These charts are particularly valuable during the planning and execution phases of projects, enabling project managers and teams to break down large projects into manageable tasks. Stakeholders can easily identify when tasks overlap and map out their interdependencies, allowing for better resource allocation and time management. Various software solutions, including Microsoft Project and Asana, facilitate the creation of Gantt charts, making it easier for teams to maintain updated schedules and track progress against initial timelines. An example can be seen in the construction industry, where Gantt charts help manage the various phases of building a structure, ensuring that critical tasks, such as foundation pouring and framing, are completed in the correct order to avoid delays. This methodology encourages collaboration among team members, as everyone involved can see the project’s status at a glance and understand their role within the larger framework. When properly utilized, Gantt charts can significantly enhance communication among stakeholders and team members, as they provide a common reference point throughout the project’s life cycle.
この方法論の主なステップ
プロジェクトの範囲に基づいて、プロジェクトのタスクとマイルストーンを定義する。
各タスクの所要時間とリソース配分を決定する。
タスク間の依存関係を確立し、一連の活動を特定する。
タスクをカレンダーに書き込んで、タイムラインを作成します。
プロジェクト期間に直接影響を与えるタスクを明確にするため、クリティカルパスを特定する。
各タスクに責任とリソースを割り当てる。
プロジェクトの変更点や進捗状況を反映させるため、ガントチャートを定期的に更新してください。
プロジェクトライフサイクル全体を通して、意思決定や調整のためにガントチャートを分析し活用する。
プロのヒント
Incorporate milestone markers in your Gantt Chart to delineate significant project phases, as this enhances progress tracking and aids in stakeholder communication.