JPLホライズンズ暦システム
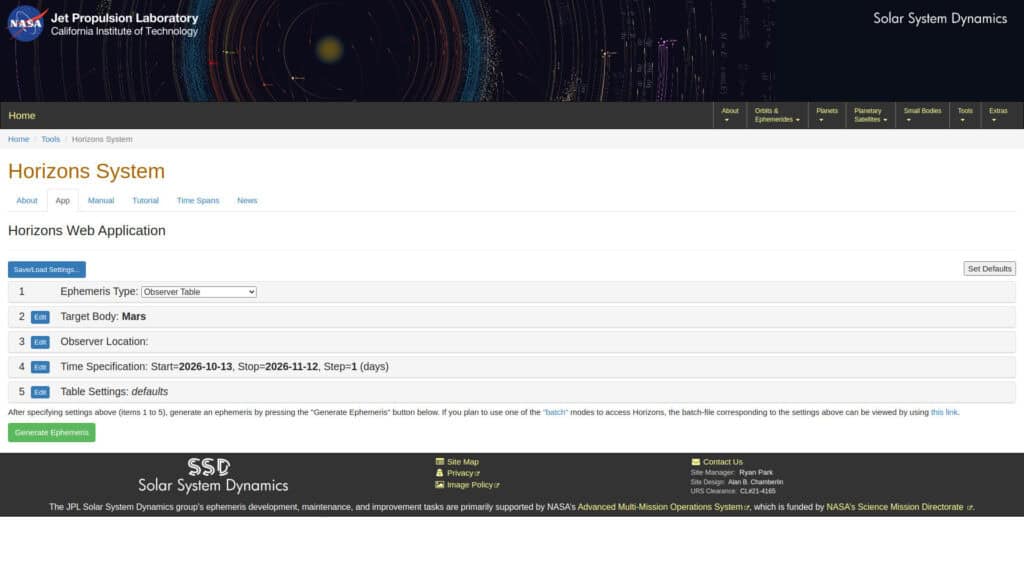
JPL Horizons is the ephemeris system of the NASA Jet Propulsion Laboratory Solar System Dynamics group. It generates positions, velocities and observer tables for planets, moons, asteroids, comets and spacecraft for chosen times and observer locations. The data come from the numerically integrated orbit solutions used in mission planning, which makes it the reference for solar system positions. Output can be requested as vectors, osculating elements or observer quantities. A must for observation, curiosity and understanding our world. Mission analysts and aerospace engineers use it to obtain state vectors for trajectory design. Astronomers and scientists use it to plan observations, and software developers use it as a validation source for […]
RAWGraphsデータ可視化
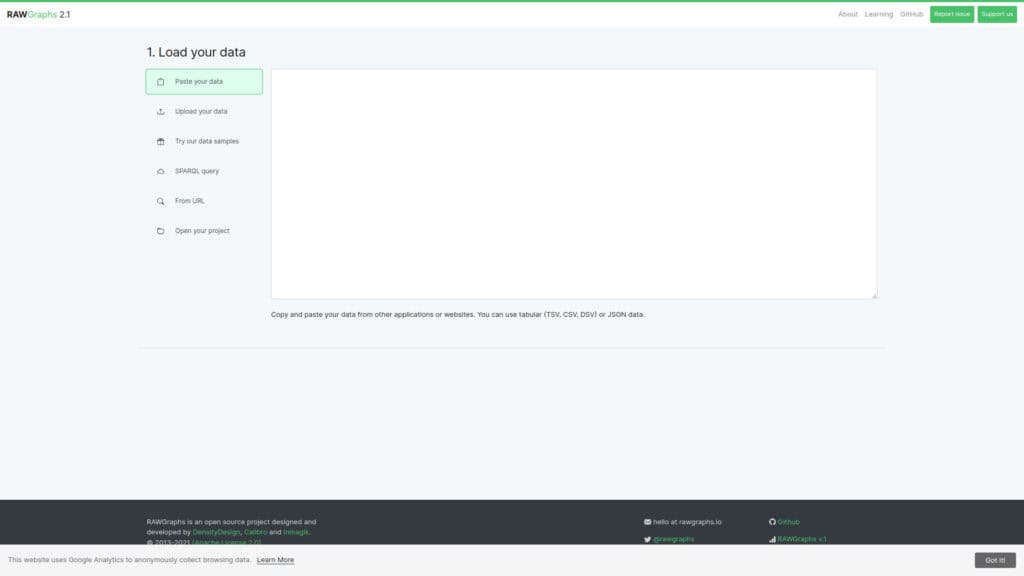
RAWGraphs is an open source tool that turns tabular data into vector charts. You paste or upload a spreadsheet, map columns to visual variables and choose among almost 30 chart models for quantities, hierarchies and time series. Data are processed only in the browser. Projects can be saved, and charts export as vector or raster images to be finished in a graphics editor. The tool is built as a link between spreadsheets and vector graphics, so the result is meant to be edited by hand and not only screenshotted. Designers produce publication quality figures from datasets that a spreadsheet cannot chart well. Scientists and engineers explore test results or measurement […]
WebPlotDigitizer プロットデータ抽出ツール
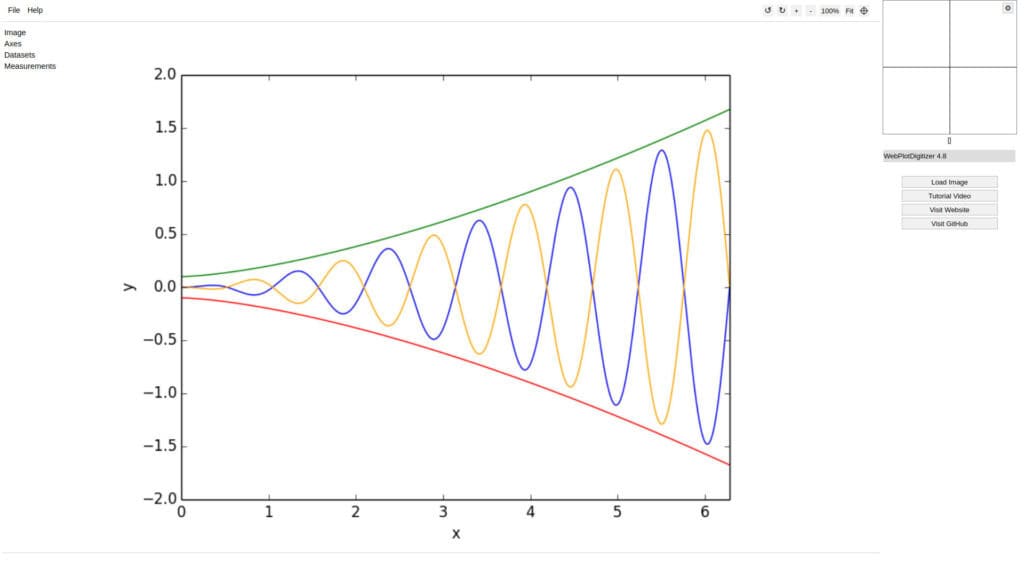
WebPlotDigitizer extracts numerical data from images of plots. You load a chart image, calibrate the axes by clicking known points, then mark data points by hand or let automatic extraction detect curves and bars.It handles XY, bar, polar and ternary plots, maps with a scale bar and circular chart recorders, supports log and date axes, and measures distances, angles and areas. The acquired data can be exported, and projects are saved as JSON or project files. It is open source under the AGPL license.the opposite: instead of drawing your datas, it extract them from plots, for more than 14 yearsScientists recover values from older papers where raw data were never […]
Wokwi ArduinoおよびESP32シミュレーター
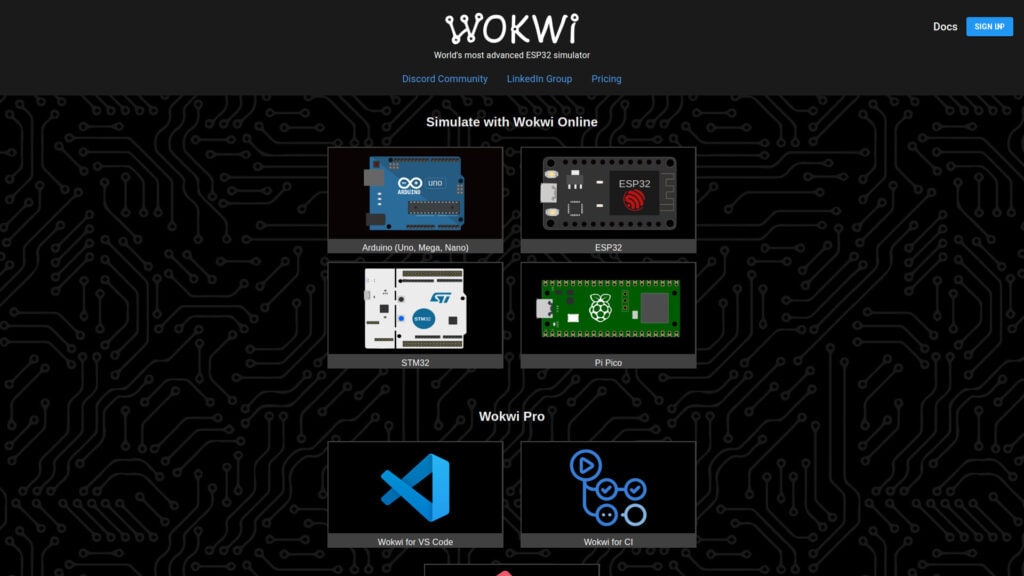
Wokwi simulates embedded projects in the browser. It supports Arduino (Uno, Mega, Nano), ESP32, STM32 and Raspberry Pi Pico boards, with displays, sensors, motors and WiFi simulation. You write the firmware in the editor, place virtual parts on a canvas, wire them and press run. The compiled firmware runs on a simulated chip, so serial output and peripheral responses can be observed without hardware. Projects are shared through a link. The paid Wokwi Pro plans add a VS Code extension, CI integration and faster builds, while the browser simulator remains free. Start from pre-built examples or use a template. Very effective. Embedded engineers prototype and debug logic before a board […]
カラーブリューワー
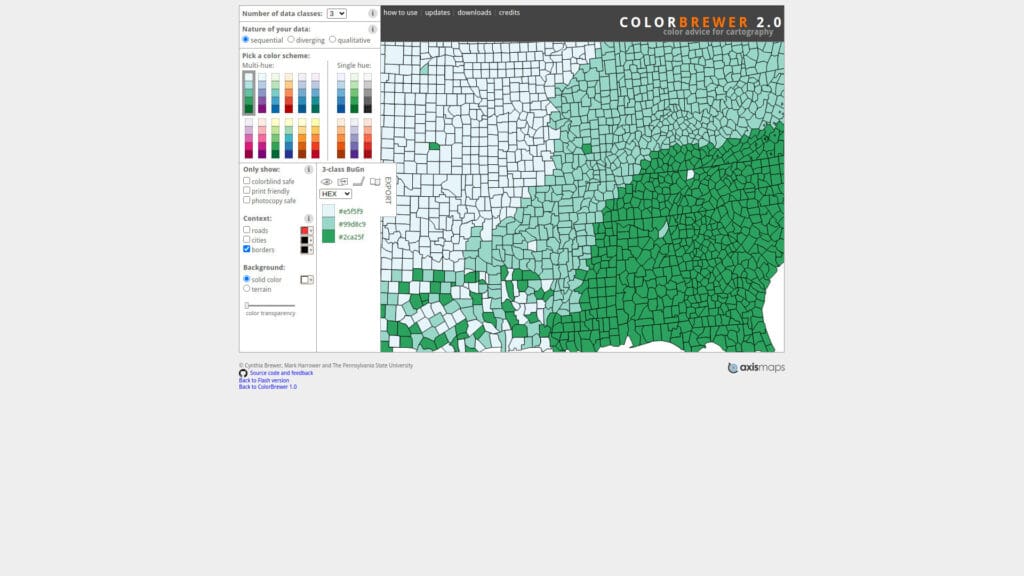
ColorBrewer is a reference tool for choosing color schemes for maps and charts, created by cartographer Cynthia Brewer at Pennsylvania State University. Schemes are grouped as sequential, diverging and qualitative, matching the type of data being shown, with up to 12 classes depending on the scheme.Each scheme can be filtered for colorblind safe, print friendly, photocopy safe and LCD friendly use, and a map preview shows the result on real geography. Colors are listed with RGB, HEX and CMYK values and can be exported for use in GIS software, plotting libraries and design tools.The same palettes are built into many tools, including matplotlib, R packages and QGIS, so the site […]
MyCurveFit
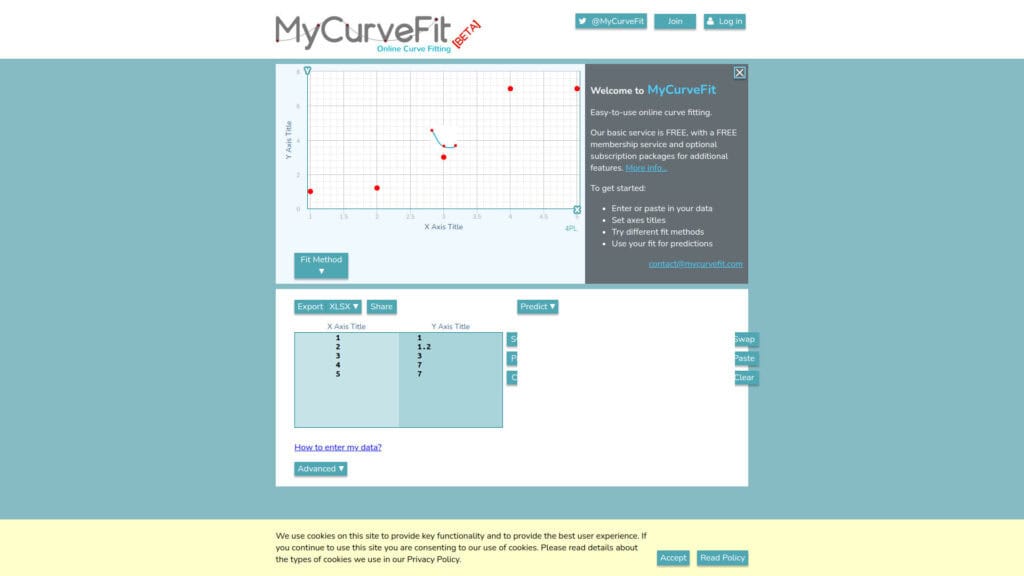
MyCurveFit fits mathematical models to measurement data directly in the browser. Data pairs are pasted or typed into a table, a model is selected or defined, and the tool returns the fitted equation, the parameter values and a plot with the curve over the points. Standard models such as linear, polynomial, exponential, power, logarithmic and sigmoidal curves are available, along with user-defined equations. The result includes goodness of fit measures such as R squared, and values can be predicted for new x values from the fitted curve. The tool suits calibration curves, dose response data, decay and growth measurements and quick empirical correlations. For statistical reporting with confidence intervals or […]
PolySolve 多項式回帰ツール
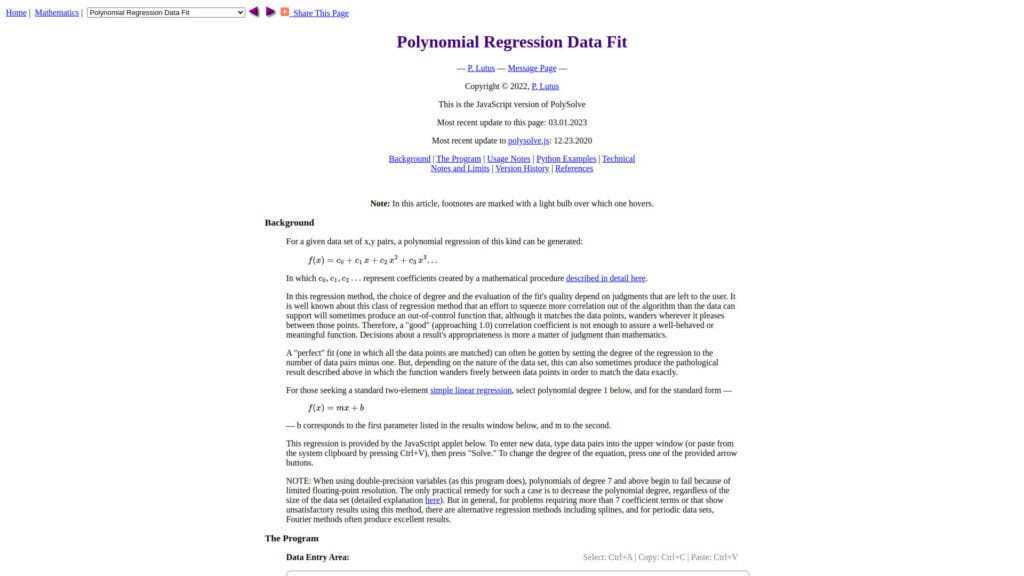
PolySolve is a polynomial regression tool by Paul Lutus that finds the least-squares polynomial of a chosen degree for a set of x and y data points. Data is pasted into a text area, the degree is selected, and the coefficients are calculated together with a plot of the fit. The output includes the coefficient list, the correlation coefficient and the standard error, and the polynomial can be given in several output forms, including source code, so the fitted function can be placed directly into firmware, spreadsheets or analysis scripts. The degree can be raised until the fit is adequate, while the displayed error shows when the model starts to […]
ウェブR
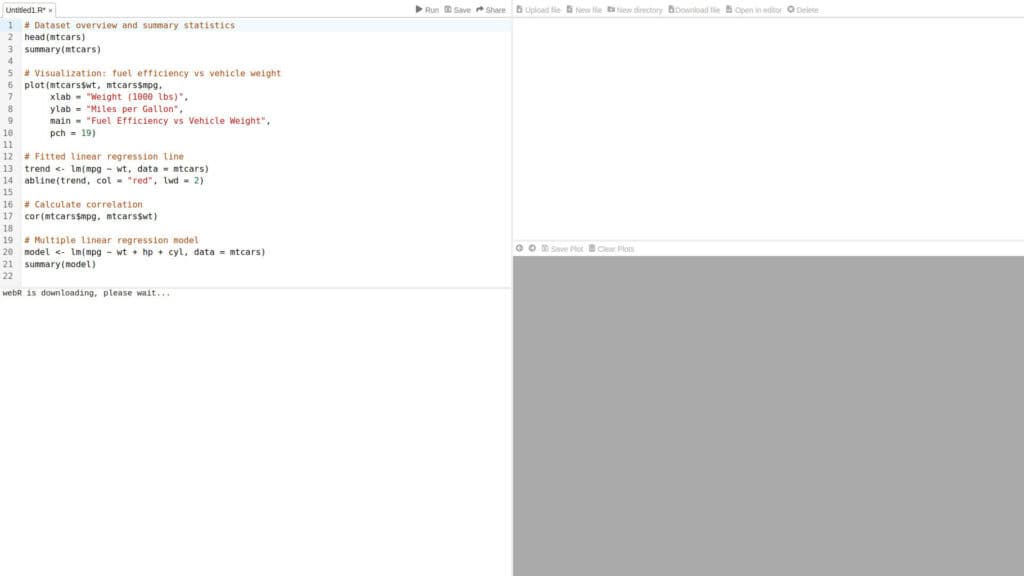
webR is a build of the R language compiled to WebAssembly, developed by Posit. The REPL page runs a full R session in the browser with a console, a file browser, a plot pane and an editor, with no server and no local R installation.Base R, graphics and statistics functions work as on a desktop, and many CRAN packages are available as precompiled WebAssembly binaries that can be installed with install.packages from the webR repository. Files can be uploaded into the virtual file system, which allows analysis of CSV and other data files.This environment is suited to short statistical analyses, teaching, reproducing results from a script and testing packages. Performance […]
Cloudflareレーダー
Cloudflare Radar publishes aggregated data from its own Cloudflare’s network, which handles a large share of global web traffic and DNS queries through 1.1.1.1. The data covers HTTP and DNS traffic volumes by country and network (ASN), with human versus bot share, device type, browser, OS, HTTP version (including HTTP/3), TLS version and post-quantum adoption, and IPv4 versus IPv6. It also covers verified bots and AI crawlers, including crawl-to-referral ratios per AI operator, as well as internet outages, BGP route leaks and hijacks, DDoS attack trends at layers 3, 4 and 7, email security (spam, DKIM, SPF, DMARC adoption), domain popularity rankings, and Internet Quality measurements (speed and latency by […]
NASA火災情報資源管理システム(FIRMS)
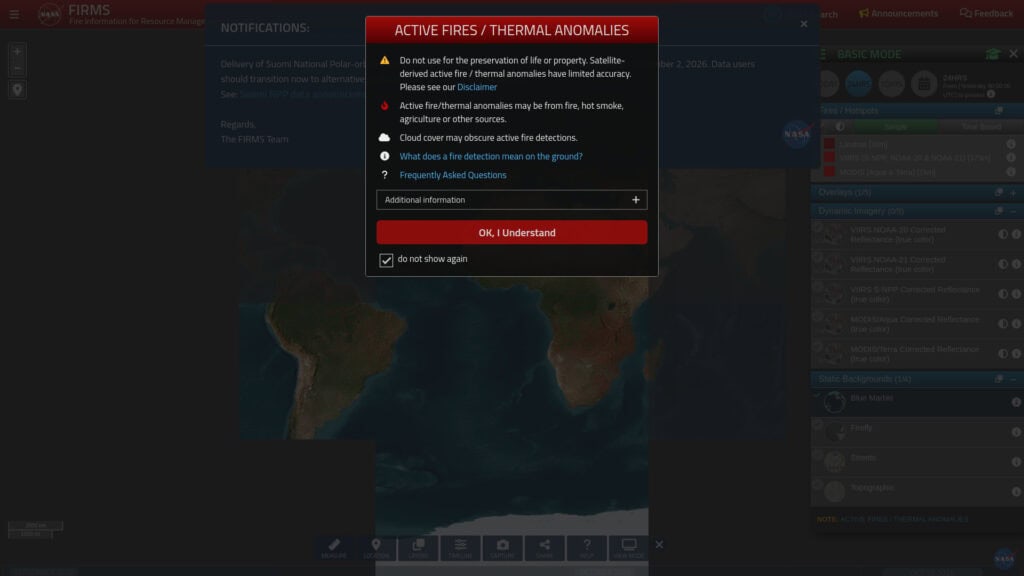
FIRMS, the Fire Information for Resource Management System, maps active fire and thermal anomaly detections from satellites. The web map shows detections from the MODIS and VIIRS instruments, with the option to select a time window such as the last 24 hours, 48 hours or 7 days. Each detection carries acquisition time, satellite, confidence level and fire radiative power, so the map can be used to judge the size and persistence of fires. Layers for true color imagery and reference boundaries are available, and the data can be downloaded, with an API available through a free map key. Latency depends on the data stream, from a few minutes to a […]