JPL 호라이즌 천체력 시스템
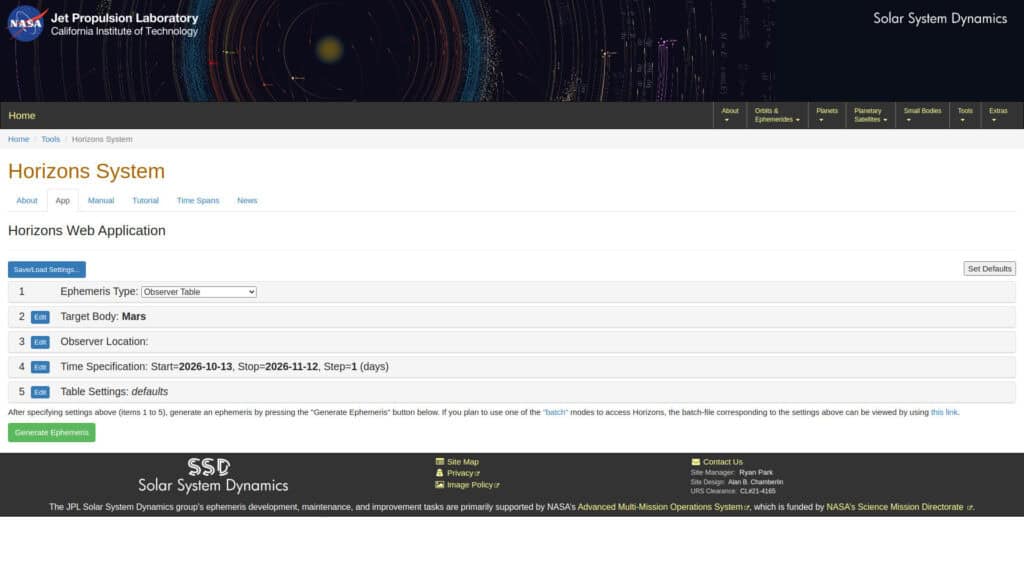
JPL Horizons is the ephemeris system of the NASA Jet Propulsion Laboratory Solar System Dynamics group. It generates positions, velocities and observer tables for planets, moons, asteroids, comets and spacecraft for chosen times and observer locations. The data come from the numerically integrated orbit solutions used in mission planning, which makes it the reference for […]
RAWGraphs 데이터 시각화
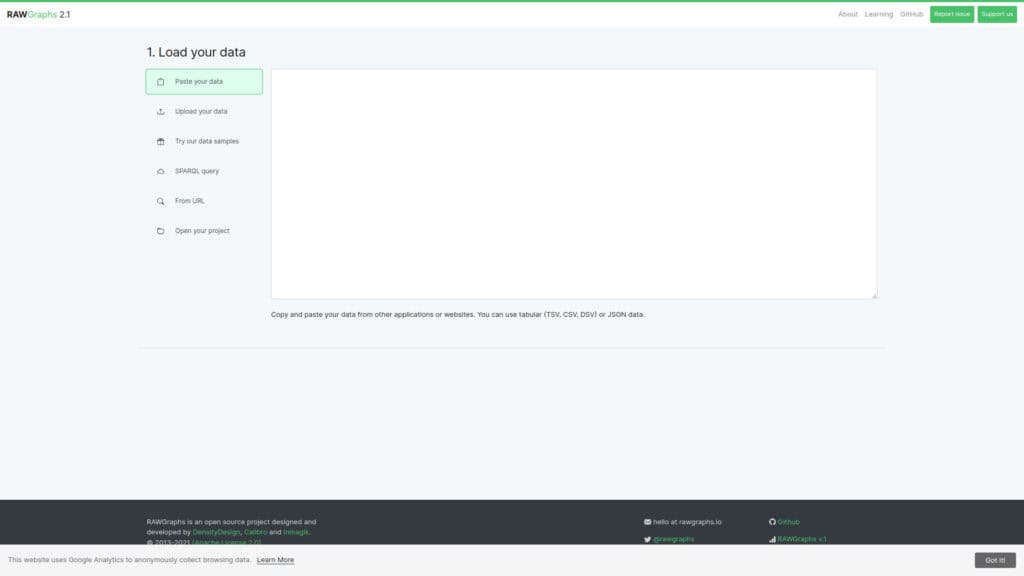
RAWGraphs is an open source tool that turns tabular data into vector charts. You paste or upload a spreadsheet, map columns to visual variables and choose among almost 30 chart models for quantities, hierarchies and time series. Data are processed only in the browser. Projects can be saved, and charts export as vector or raster […]
WebPlotDigitizer 플롯 데이터 추출기
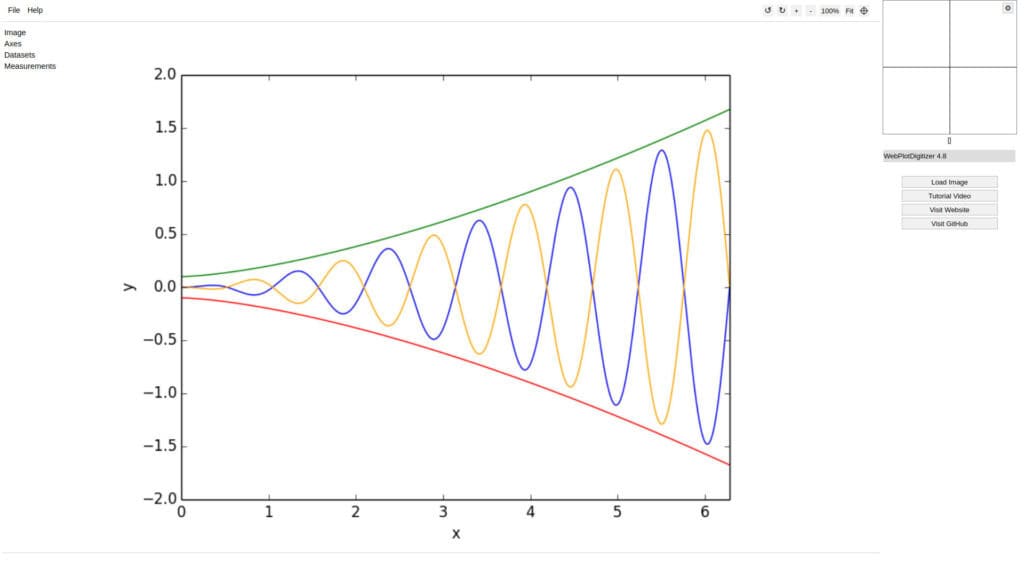
WebPlotDigitizer extracts numerical data from images of plots. You load a chart image, calibrate the axes by clicking known points, then mark data points by hand or let automatic extraction detect curves and bars.It handles XY, bar, polar and ternary plots, maps with a scale bar and circular chart recorders, supports log and date axes, […]
Wokwi 아두이노 및 ESP32 시뮬레이터
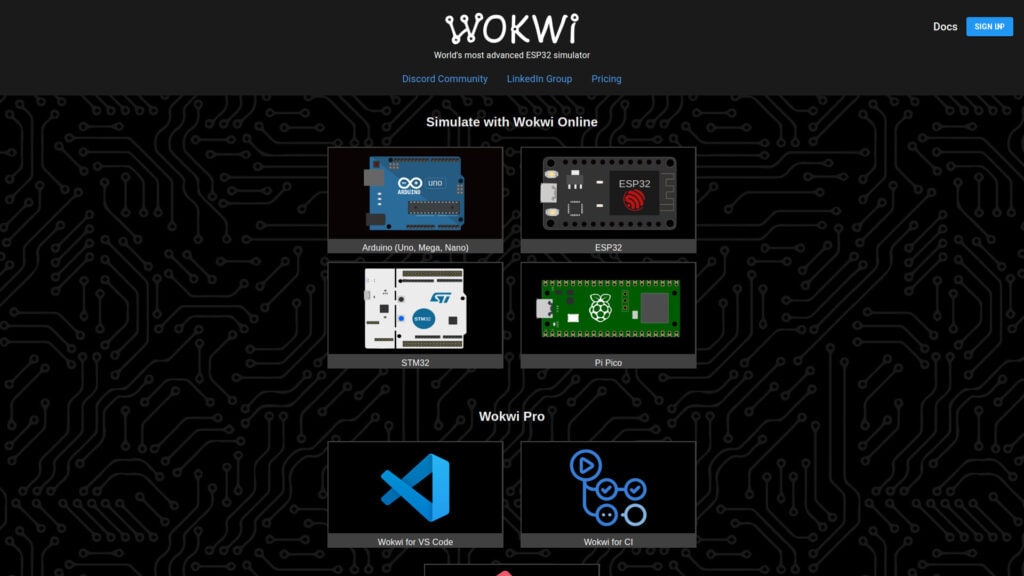
Wokwi simulates embedded projects in the browser. It supports Arduino (Uno, Mega, Nano), ESP32, STM32 and Raspberry Pi Pico boards, with displays, sensors, motors and WiFi simulation. You write the firmware in the editor, place virtual parts on a canvas, wire them and press run. The compiled firmware runs on a simulated chip, so serial […]
컬러브루어
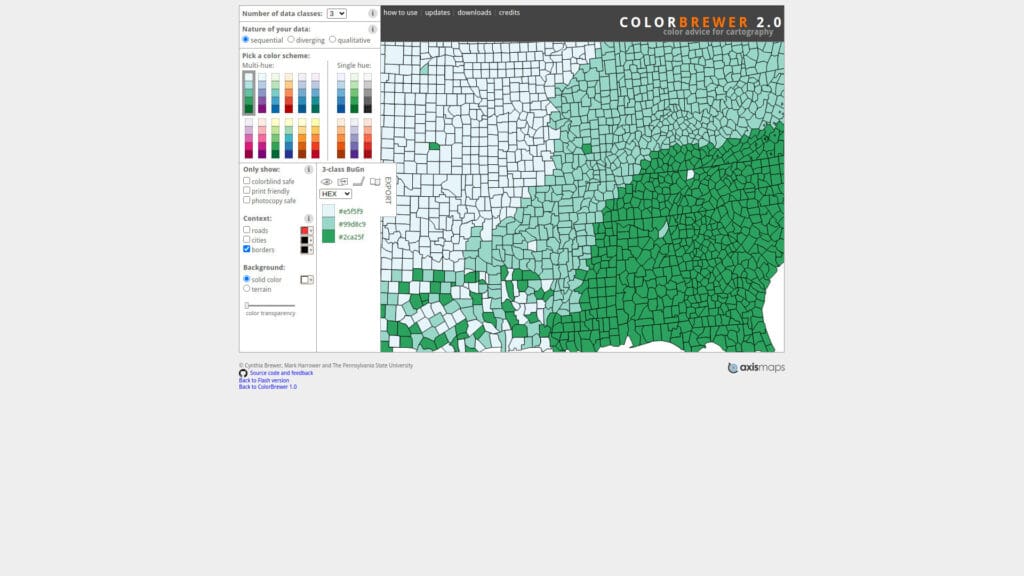
ColorBrewer is a reference tool for choosing color schemes for maps and charts, created by cartographer Cynthia Brewer at Pennsylvania State University. Schemes are grouped as sequential, diverging and qualitative, matching the type of data being shown, with up to 12 classes depending on the scheme.Each scheme can be filtered for colorblind safe, print friendly, […]
마이커브핏
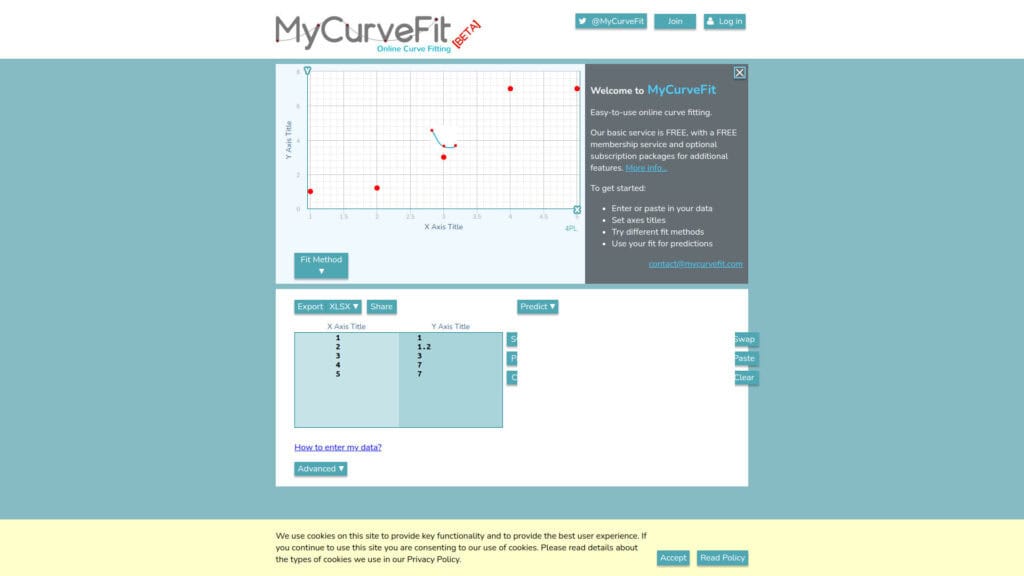
MyCurveFit fits mathematical models to measurement data directly in the browser. Data pairs are pasted or typed into a table, a model is selected or defined, and the tool returns the fitted equation, the parameter values and a plot with the curve over the points. Standard models such as linear, polynomial, exponential, power, logarithmic and […]
PolySolve 다항 회귀 분석 도구
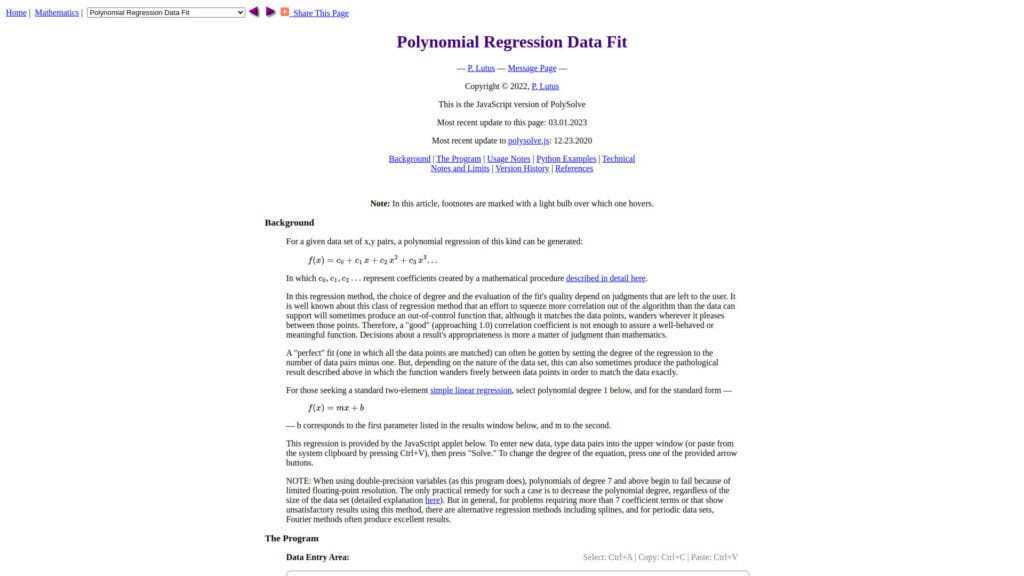
PolySolve is a polynomial regression tool by Paul Lutus that finds the least-squares polynomial of a chosen degree for a set of x and y data points. Data is pasted into a text area, the degree is selected, and the coefficients are calculated together with a plot of the fit. The output includes the coefficient […]
웹R
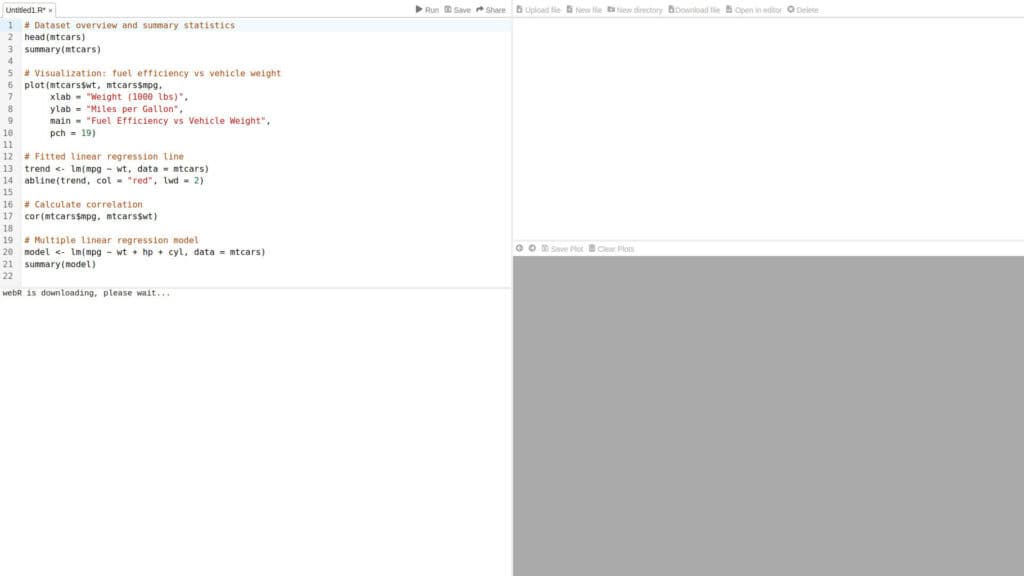
webR is a build of the R language compiled to WebAssembly, developed by Posit. The REPL page runs a full R session in the browser with a console, a file browser, a plot pane and an editor, with no server and no local R installation.Base R, graphics and statistics functions work as on a desktop, […]
클라우드플레어 레이더
Cloudflare Radar publishes aggregated data from its own Cloudflare’s network, which handles a large share of global web traffic and DNS queries through 1.1.1.1. The data covers HTTP and DNS traffic volumes by country and network (ASN), with human versus bot share, device type, browser, OS, HTTP version (including HTTP/3), TLS version and post-quantum adoption, […]
NASA 산불 정보 자원 관리 시스템(FIRMS)
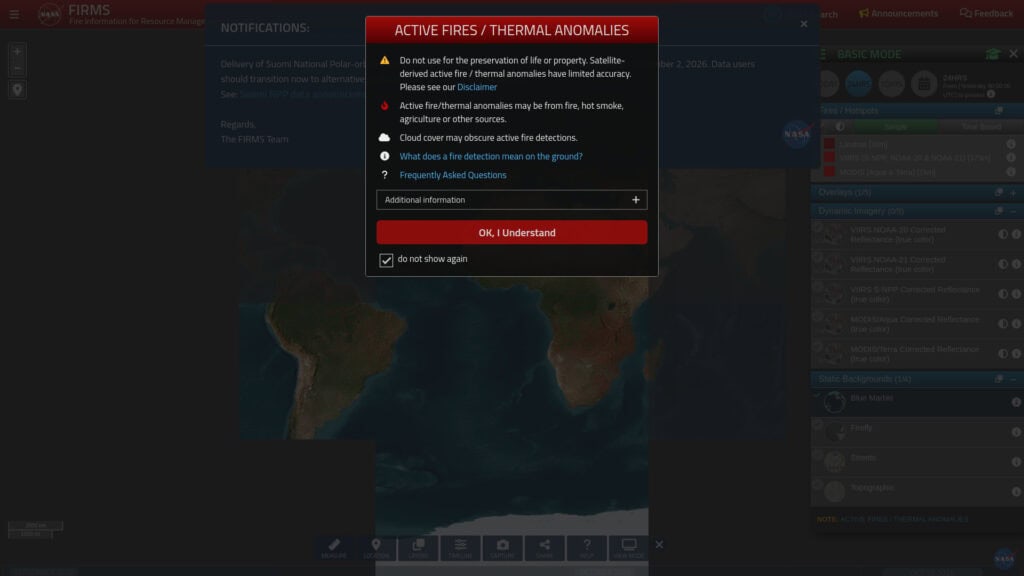
FIRMS, the Fire Information for Resource Management System, maps active fire and thermal anomaly detections from satellites. The web map shows detections from the MODIS and VIIRS instruments, with the option to select a time window such as the last 24 hours, 48 hours or 7 days. Each detection carries acquisition time, satellite, confidence level […]