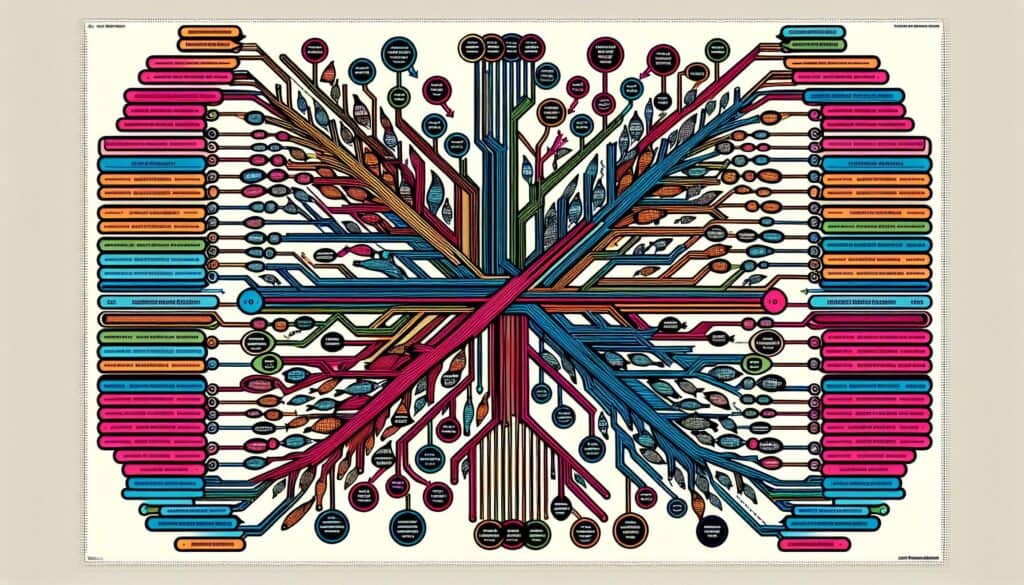
The Fishbone Diagram, or Ishikawa Diagram, is particularly useful in industries such as manufacturing, healthcare, and software development for identifying root causes of quality issues. Commonly employed during the analysis phase of problem-solving, teams typically initiate this methodology during brainstorming sessions that draw participants from diverse functions including engineering, quality assurance, operations, and management. By categorizing causes into defined groups such as People, Process, Equipment, Materials, Environment, and Management, teams can explore not just immediate factors but also underlying systemic issues contributing to a problem. This structured approach encourages collaborative input from all members, fostering a culture of engagement and shared responsibility in troubleshooting. For instance, in a product development setting, a Fishbone Diagram might be used to dissect delays in a project timeline, allowing teams to systematically address challenges ranging from resource allocation to communication breakdowns. The diagram’s visual representation enables stakeholders to grasp the interconnections among various causes, making it a practical tool for continuous improvement initiatives or root cause analysis in six sigma projects, enhancing the quality of products and services delivered. This method can be beneficial in various scenarios, such as during the review of customer feedback regarding product defects or when addressing inefficiencies in operational workflows, ensuring a comprehensive exploration of potential sources of problems while steering clear of symptomatic fixes.
この方法論の主なステップ
プロのヒント
複数の方法論を読み比べて、 私たちは、
> 包括的な方法論リポジトリ <
400以上の他の手法と併せて。
この方法論に関するご意見や追加情報は、 以下のコメント欄 ↓、エンジニアリング関連のアイデアやリンクも同様です。