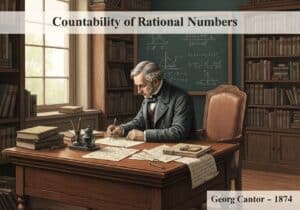
Product Design, Manufacturing & Innovation Resources

分散分析(ANOVA)

分散分析

分散分析(ANOVA)

客観的:

2つ以上のグループの平均値を比較し、それらの間に統計的に有意な差があるかどうかを判断する。

使用方法:

長所

短所

カテゴリー:

最適な用途:

ANOVA, or analysis of variance, plays a significant role in various industries such as pharmaceuticals, agriculture, manufacturing, and marketing, particularly during the experimental design and data analysis phases of projects. This methodology allows teams to evaluate the effects of different treatments or conditions on a dependent variable, making it applicable in clinical trial designs to compare the efficacy of medications across diverse groups or in quality control processes where product variations might result from changes in production methods. Participants can include data analysts, researchers, quality assurance teams, and product managers, with initiation often coming from project leads or statisticians who recognize the need for rigorous testing of hypotheses regarding product efficacy or safety. In addition to identifying significant differences between groups, ANOVA’s factorial design capabilities enable the exploration of interaction effects between multiple independent variables, enhancing the understanding of complex systems. This flexibility is particularly advantageous in industries that deal with multifactorial experiments, such as agricultural experiments involving different fertilizers and weather conditions. Also, by utilizing ANOVA, organizations can optimize resource allocation by efficiently determining which product formulations yield the best outcomes, indirectly supporting innovation by focusing development efforts on the most promising alternatives. Lastly, when conducting ANOVA, it’s important to validate assumptions regarding normality and homogeneity of variance to ensure the integrity of results, with follow-up post-hoc tests available to identify specific group differences when the overall test indicates significance.

この方法論の主なステップ

  1. グループ平均に関する帰無仮説と対立仮説を述べなさい。
  2. 仮説検定における有意水準(アルファ)を​​決定する。
  3. データセット全体の平均値を計算します。
  4. 比較対象となる各グループの平均値を計算してください。
  5. データセット内の総変動(総平方和)を計算します。
  6. 系統的変動(群間平方和)を計算します。
  7. 誤差変動(グループ内平方和)を計算します。
  8. 全体、グループ間、およびグループ内の自由度を求めなさい。
  9. グループ間およびグループ内の平均平方を計算してください。
  10. F比は、群間平均平方を群内平均平方で割ることによって計算します。
  11. 計算されたF比を、F分布表から得られた臨界F値と比較してください。
  12. F値の比較に基づいて、帰無仮説に関する結論を導き出してください。

プロのヒント

  • 有意なF統計量が見つかった後、どのグループの平均値が異なっているかを把握するために、TukeyのHSDなどの事後検定を利用してください。
  • 複数の要因を分析する際には、要因分散分析に交互作用効果を組み込むことで、変数間の微妙な関係性を明らかにすることができます。
  • 独立変数と反復変数の両方を扱う場合、異なる実験条件間の変動性を効果的に評価するために、混合設計分散分析を用いる。

複数の方法論を読み比べて、 私たちは、

> 包括的な方法論リポジトリ  <
400以上の他の手法と併せて。

この方法論に関するご意見や追加情報は、 以下のコメント欄 ↓、エンジニアリング関連のアイデアやリンクも同様です。

歴史的背景

-300
-550
1750
1790
1800
1844
1874
-300
-450
1585
1779
1799
1801
1850
1875

(日付が不明または関連性がない場合、例えば「流体力学」などでは、その注目すべき出現時期の概算値が提示されます。)

関連記事

フルサイズの画像とダウンロードは、登録会員のみが100%無料で利用できます。