Product Design, Manufacturing & Innovation Resources

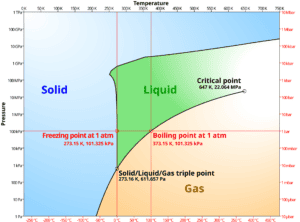
Diagrama de fases

A phase diagram is a graphical representation that illustrates the relationships between different phases of a material as a function of temperature, pressure, and composition. It serves as a critical tool in product design and innovation, enabling researchers and engineers to understand the stability and transitions of materials under varying conditions. By analyzing phase diagrams, teams can make informed decisions regarding material selection and processing techniques, ultimately enhancing the efficiency and effectiveness of production processes.

Diagrama de fases simplificado del agua

Punto triple del agua

El punto triple del agua y cómo sortear este punto es un tema imprescindible en ingeniería (yo tenía un

décimo año aniversario

Las imágenes en tamaño completo y las descargas solo están disponibles, de forma totalmente gratuita, para los miembros registrados.

> Acceso <