NetBlocks compared with Cloudflare Radar and IODA| 넷블록스 | 클라우드플레어 레이더 | IODA |
|---|
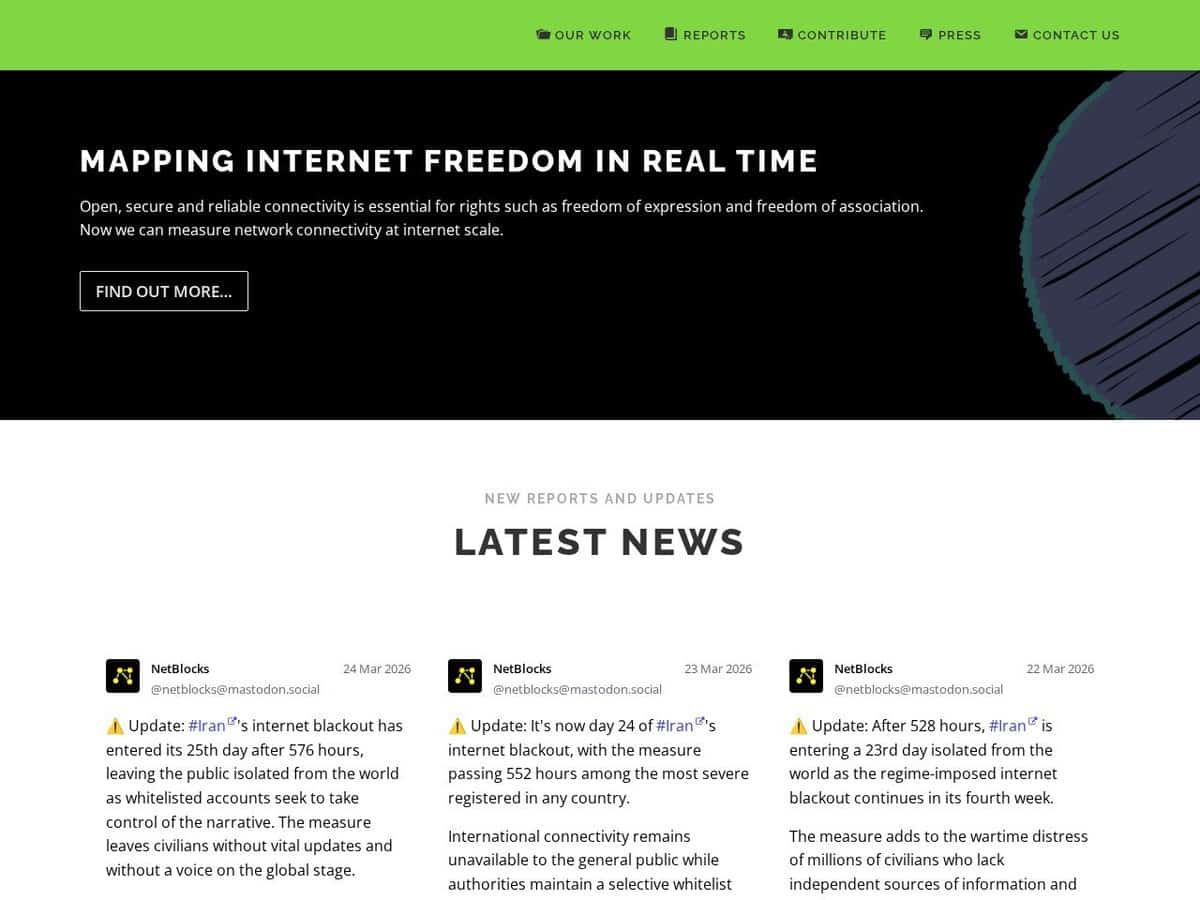
| Measurement basis: The Internet Observatory is presented as a real-time measurement service for human rights work. The public site does not detail the measurement method, so the technical basis cannot be audited from it. | Measurement basis: The Outage Center classifies events by scope (nationwide, sub-national, or a single network provider) and records the affected locations and ASNs. The documentation does not name the underlying data sources. | Measurement basis: Combines three signals: BGP routing data from RouteViews and RIPE RIS, unsolicited traffic seen by a network telescope, and active ICMP probing of /24 blocks. A Google Transparency Report signal is also used. Documented methods make results easier to verify. |
| Granularity and limits: Output is organised around country-level events such as election-day cuts, social media restrictions and exam-related disruptions, reported as individual items. | Granularity and limits: Events carry a scope that can name a state, a city or a network, and a stated cause category such as government order, weather, or cable damage. | Granularity and limits: Signals are aggregated per economy, ASN and first-level administrative region. It targets large outages only, and a February 2024 mobile shutdown in Pakistan went undetected because mobile endpoints rarely answer active probes. |
| Output and access: Published as written reports plus the Observatory service. The site links a Data Usage Policy, whose terms should be read before reuse of the material. | Output and access: Outage data can be queried at the Radar annotations endpoint with a bearer token, using limit, offset, dateRange and format parameters. Each record includes start and end dates, scope, cause and type. | Output and access: Graphs, overlays and a dashboard of recent high-scoring outages are published on the public website. The documentation reviewed does not mention a public API or bulk download. |
| Operator and status: Based in London and privately held, owned and run by Alp Toker. It describes itself as independent and non-partisan, and NetBlocks is a registered trademark of Netblocks Ltd. | Operator and status: The Outage Center is part of Cloudflare Radar and is documented in the Cloudflare developer documentation. | Operator and status: A CAIDA project that moved to Georgia Tech in August 2021. The project page describes it as an experimental service running 24/7, and its tools are open source (BGPStream, libtimeseries, Corsaro). |
| Cause attribution: Lists causes such as government-ordered shutdowns, weather, infrastructure failures, power loss, and filtering, drawn from publicly available information. | Cause attribution: Cannot determine causes by itself. Attribution requires collaboration with other experts and local contacts, and significant events are verified manually before announcement. |