전환율, 고객 경험, 지속가능성을 위한 디자인, 디자인 사고, Interaction Design, 사용성, 사용성 테스트, 사용자 경험(UX), 사용자 인터페이스(UI)
목적:
웹사이트에서 사용자가 클릭하고, 이동하고, 스크롤하는 위치를 시각화합니다.
사용 방법:
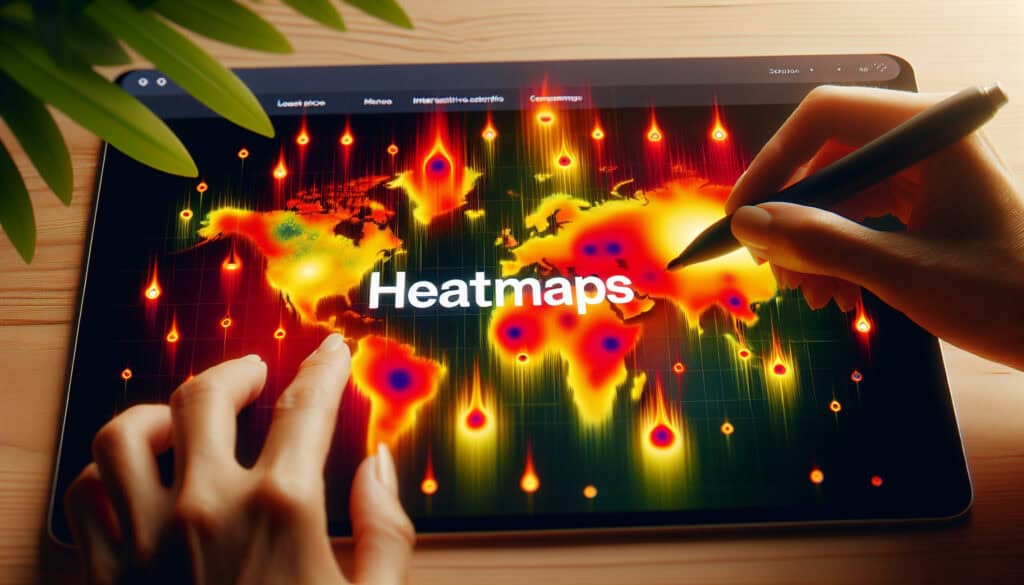
데이터 값을 색상으로 나타내는 그래프 표현 방식입니다. 웹사이트 히트맵은 사용자가 페이지에서 어디를 클릭했는지, 얼마나 스크롤했는지, 마우스를 어디로 이동했는지 등을 보여줍니다. 이를 통해 사용자 행동을 이해하고 개선이 필요한 부분을 파악할 수 있습니다.
장점
Provides a clear and visual way to understand user behavior; Helps to identify 사용성 issues and optimize conversions.
단점
사용자 행동의 '이유'를 설명하지 못하며, 잘못 해석할 경우 오해를 불러일으킬 수 있습니다.
카테고리:
고객 및 마케팅, 제품 디자인
다음과 같은 경우에 가장 적합합니다:
웹사이트 레이아웃과 디자인을 최적화하여 사용자 참여도와 전환율을 향상시킵니다.
Heatmaps, as a graphical representation of data denoting different values through color variations, find extensive utility in various industries such as e-commerce, digital marketing, software development, and user experience design. Common applications include analyzing user interactions on landing pages, mobile apps, and dashboards, providing designers and developers with the ability to visualize where users are most engaged and where they drop off. The methodology is particularly adaptable during the testing phase of a product lifecycle, especially in conjunction with A/B testing and user feedback sessions, allowing teams to refine layouts, content placement, and call-to-action elements effectively. Participants in this process typically include UX/UI designers, data analysts, product managers, and marketing specialists, all of whom collaborate to interpret heatmap data and implement actionable changes to enhance user experience. Tools such as Crazy Egg or Hotjar facilitate this gathering of information, making it easier for teams to visualize interaction patterns, thus validating design choices with empirical evidence. This method not only accelerates the decision-making process but also directly ties user engagement metrics to design optimizations, ultimately aligning product functionalities with user expectations and preferences.
이 방법론의 주요 단계
사용자 행동 분석을 위한 주요 지표와 목표를 정의하십시오.
사용할 히트맵 유형을 선택하세요(클릭, 스크롤, 이동).
웹사이트에 히트맵 추적 코드를 통합하세요.
지정된 기간 동안 사용자 상호작용 데이터를 모니터링합니다.
히트맵 데이터를 분석하여 사용자 참여 패턴을 파악합니다.
웹사이트에서 최적화가 필요한 부분을 파악하세요.
전환율에 미칠 수 있는 잠재적 영향을 기준으로 변경 사항의 우선순위를 정하십시오.
히트맵 분석 결과를 바탕으로 디자인 변경 사항을 적용하세요.
변경 사항의 효과를 평가하기 위해 후속 테스트를 실시하십시오.
프로 팁
사용자 세션 녹화 영상에 히트맵을 레이어링하여 정량적 데이터와 정성적 행동을 연결함으로써 사용자 상호작용을 더 깊이 이해할 수 있습니다.
사용자 인구 통계 또는 트래픽 소스를 기준으로 히트맵 데이터를 세분화하여 행동 패턴의 차이를 파악하고 효과적으로 전략을 맞춤화하세요.
A/B 테스트 결과를 히트맵 분석 결과와 통합하여 디자인 변경 및 해당 변경 사항이 참여도 지표에 미치는 직접적인 영향에 대해 더욱 정확한 의사 결정을 내릴 수 있습니다.