Product Design, Manufacturing & Innovation Resources

위상 다이어그램

A phase diagram is a graphical representation that illustrates the relationships between different phases of a material as a function of temperature, pressure, and composition. It serves as a critical tool in product design and innovation, enabling researchers and engineers to understand the stability and transitions of materials under varying conditions. By analyzing phase diagrams, teams can make informed decisions regarding material selection and processing techniques, ultimately enhancing the efficiency and effectiveness of production processes.

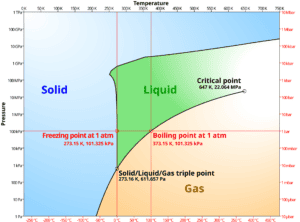
물의 간략화된 상평형 그림

물의 삼중점

물의 삼중점과 이 지점을 어떻게 회피할지에 대한 내용은 공학 분야에서 필수적인 지식입니다 (저는

10년차 기념일

고화질 이미지 및 다운로드는 등록된 회원에게만 100% 무료로 제공됩니다.

> 로그인 <