D3 Data Visualization Gallery compared with Tableau, Power BI and Highcharts| D3 डेटा विज़ुअलाइज़ेशन गैलरी | चित्रमय तसवीर | Power BI | Highcharts |
|---|
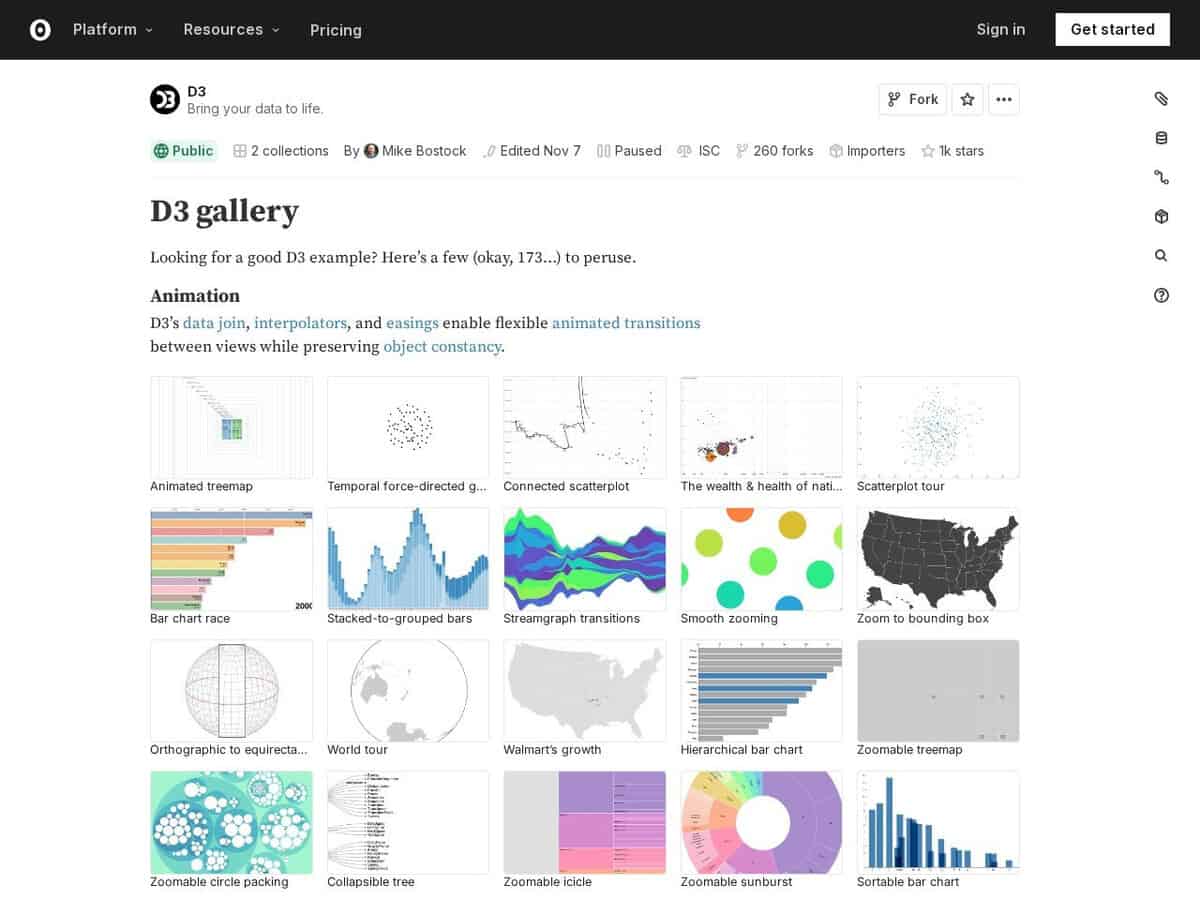
| Nature of the product: The gallery is published by the D3 account on Observable and shows examples of D3, which its GitHub page calls a free, open-source JavaScript library for visualizing data. | Nature of the product: Tableau is a commercial product family with Desktop, Cloud and Server deployment options, plus a free Tableau Public offer listed under its community section. | Nature of the product: Power BI Desktop is a Microsoft application for building interactive reports. It is described as a drag-and-drop canvas with a Power Query data preparation experience and data modelling tools. | Nature of the product: Highcharts Core is a JavaScript charting library. Like D3 it is used from code, but it is a packaged chart library installed with npm install highcharts. |
| Rendering technology: D3 is described as bringing data to life with SVG, Canvas and HTML, so the developer chooses how each mark is drawn. | | | Rendering technology: Highcharts Core is based on SVG. A WebGL-powered boost module is available for very large datasets. |
| लाइसेंस और लागत: D3 is released under the ISC licence and is free to use. | लाइसेंस और लागत: Pricing is not shown on the product trial page, which points to a pricing calculator and a sales contact. Tableau Public is offered for free, and students and teachers can get Tableau free through Academic Programs. | लाइसेंस और लागत: Power BI Desktop is listed as free. Power BI Pro is a paid per-seat subscription, billed yearly. | लाइसेंस और लागत: Commercial projects need the appropriate licence in place, with pricing on the Highcharts shop. An Educational License is listed, and downloading the source for inspection does not require a trial licence. |
| Data connection and modelling: D3 itself binds data to the page in the browser. Data loading, cleaning and any statistics are written by the developer. | | Data connection and modelling: Power BI connects to hundreds of on-premises and cloud sources such as Excel, SharePoint, Salesforce and Azure SQL Database. DAX, a formula language, is available for advanced models. | Data connection and modelling: Highcharts renders the data it is given. The vendor lists integrations for React, Angular, Vue, Node.js, Python and Svelte, and wrappers for .NET, PHP, R, Java, iOS and Android. |
| Extending and embedding: Because D3 is a library, the output can sit in any web page, which is the way the visualisations on this site are produced. Examples written for older D3 versions may break on current versions. | | Extending and embedding: Reports can be published to the cloud or on-premises and embedded in apps or websites. Custom visuals can be built with an open-source framework. | Extending and embedding: The library is embedded in web applications through the official integrations listed by the vendor. |