Product Design, Manufacturing & Innovation Resources

गंत्त चार्ट

गंत्त चार्ट

गंत्त चार्ट

उद्देश्य:

किसी प्रोजेक्ट की समय-सारणी को दृश्य रूप से प्रस्तुत करने के लिए, जिसमें कार्य, उनकी अवधि, प्रारंभ और समाप्ति तिथियां, निर्भरताएं और समग्र प्रोजेक्ट समयरेखा दिखाई गई हो।

इसका उपयोग कैसे किया जाता है:

फायदे

नुकसान

श्रेणियाँ:

इसके लिए सबसे अच्छा:

Gantt charts find wide-ranging applications across industries such as construction, software development, manufacturing, and event planning, providing a structured approach to managing projects of varying scales. Often utilized in the planning phase, these charts are particularly effective when teams are determining timelines and task sequences, allowing project managers and stakeholders to allocate resources efficiently. The clarity gained from visualizing tasks alongside dependencies enables teams to identify potential bottlenecks early in the project timeline, facilitating timely adjustments. In engineering fields, where product development cycles may include prototyping, testing, and iteration, Gantt charts serve to outline each phase distinctly, advancing collaboration among cross-functional teams by promoting transparency in progress tracking. Participants in this methodology typically include project managers, team leads, and departmental stakeholders, who contribute to delineating task responsibilities and milestones. As projects progress, updates to the Gantt chart can reflect real-time developments, which maintains an accurate representation of the project’s status and fosters better communication across diverse teams. This adaptability makes Gantt charts especially beneficial in environments where tasks are interdependent and where stakeholder approval at various stages is required, as it allows for quick visual references during meetings and updates.

इस पद्धति के प्रमुख चरण

  1. परियोजना को पूरा करने के लिए आवश्यक सभी कार्यों की पहचान करें।
  2. कार्यों का क्रम निर्धारित करें और निर्भरताओं की पहचान करें।
  3. प्रत्येक कार्य की अवधि निर्धारित करें।
  4. आवश्यकतानुसार प्रत्येक कार्य के लिए संसाधन आवंटित करें।
  5. एक ऐसी समयरेखा बनाएं जिसमें सभी कार्य और निर्भरताएं शामिल हों।
  6. कार्यों की अवधि और निर्भरता को दर्शाते हुए गैंट चार्ट बनाएं।
  7. परियोजना की प्रगति को दर्शाने के लिए गैंट चार्ट को नियमित रूप से अपडेट करें।
  8. परियोजना के विकास के साथ-साथ समय-सीमा और संसाधनों की समीक्षा करें और उनमें समायोजन करें।

प्रो टिप्स

  • परियोजना की प्रगति के साथ-साथ गैंट चार्ट में नियमित अपडेट को एकीकृत करें, जो सटीकता के लिए कार्य अवधि और निर्भरताओं में वास्तविक समय के परिवर्तनों को दर्शाता है।
  • Utilize color coding to distinguish between various phases, teams, or task types, enhancing visual comprehension and prioritization.
  • महत्वपूर्ण कार्यों के लिए अतिरिक्त समय निर्धारित करें ताकि देरी के जोखिम को कम किया जा सके, जिससे हितधारकों की अपेक्षाओं को प्रभावी ढंग से प्रबंधित करने में सहायता मिलेगी।

विभिन्न पद्धतियों को पढ़ने और उनकी तुलना करने के लिए, हम अनुशंसा करते हैं

> व्यापक कार्यप्रणाली भंडार  <
अन्य 400 से अधिक पद्धतियों के साथ।

इस कार्यप्रणाली पर आपकी टिप्पणियाँ या अतिरिक्त जानकारी का स्वागत है। नीचे टिप्पणी अनुभाग देखें ↓ , साथ ही इंजीनियरिंग से संबंधित कोई भी विचार या लिंक।

ऐतिहासिक संदर्भ

1974
1974
1978
1980
1980
1980
1980
1972
1974
1975-06-01
1980
1980
1980
1980
1980

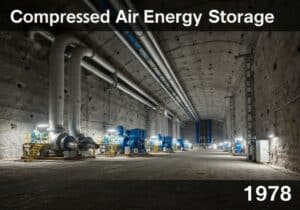
(यदि तिथि अज्ञात है या प्रासंगिक नहीं है, उदाहरण के लिए "द्रव यांत्रिकी", तो इसके उल्लेखनीय उद्भव का एक अनुमानित आंकड़ा प्रदान किया गया है)

संबंधित पोस्ट

पंजीकृत सदस्यों के लिए पूर्ण आकार की छवियाँ और डाउनलोड 100% निःशुल्क उपलब्ध हैं।