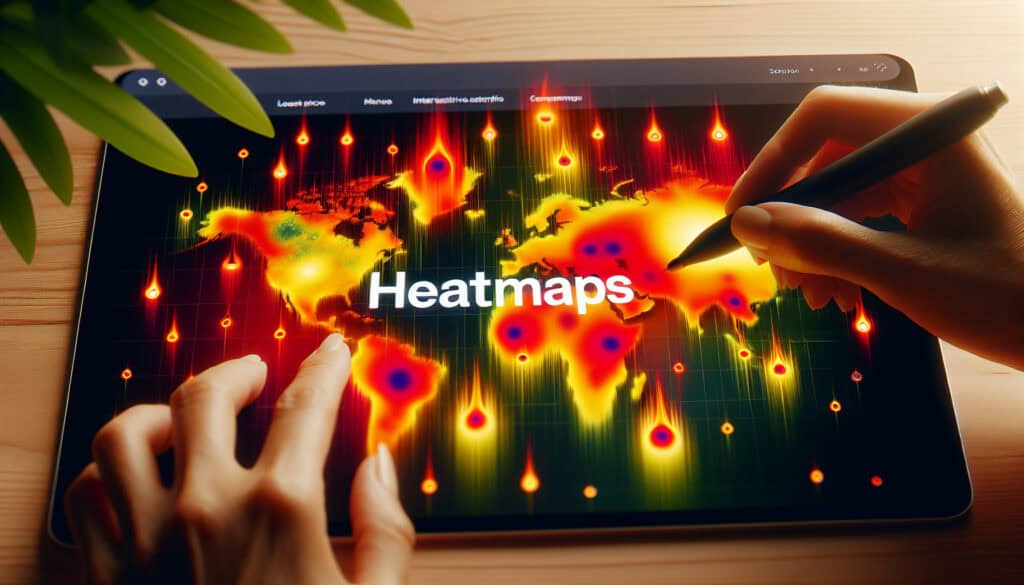
To visualize where users click, move, and scroll on a website.
- Metodologías: Ergonomía
Mapas de calor
Mapas de calor
- Tasa de conversión, Experiencia del cliente, Diseño para la sostenibilidad, Pensamiento de diseño, Diseño de interacción, Usabilidad, Pruebas de usabilidad, Experiencia de usuario (UX), Interfaz de usuario (UI)
Objetivo:
Cómo se utiliza:
- A graphical representation of data where values are depicted by color. Website heatmaps show where users have clicked on a page, how far they have scrolled, and where they have moved their mouse. This helps to understand user behavior and identify areas for improvement.
Ventajas
- Provides a clear and visual way to understand user behavior; Helps to identify usability issues and optimize conversions.
Contras
- Does not explain the 'why' behind user behavior; Can be misleading if not interpreted correctly.
Categorías:
- Clientes y marketing, Diseño de producto
Ideal para:
- Optimizing the layout and design of a website to improve user engagement and conversions.
Heatmaps, as a graphical representation of data denoting different values through color variations, find extensive utility in various industries such as e-commerce, digital marketing, software development, and user experience design. Common applications include analyzing user interactions on landing pages, mobile apps, and dashboards, providing designers and developers with the ability to visualize where users are most engaged and where they drop off. The methodology is particularly adaptable during the testing phase of a ciclo de vida del producto, especially in conjunction with A/B testing and user feedback sessions, allowing teams to refine layouts, content placement, and call-to-action elements effectively. Participants in this process typically include UX/UI designers, data analysts, product managers, and marketing specialists, all of whom collaborate to interpret heatmap data and implement actionable changes to enhance user experience. Tools such as Crazy Egg or Hotjar facilitate this gathering of information, making it easier for teams to visualize interaction patterns, thus validating design choices with empirical evidence. This method not only accelerates the decision-making process but also directly ties user engagement metrics to design optimizations, ultimately aligning product functionalities with user expectations and preferences.
Pasos clave de esta metodología
- Define key metrics and goals for user behavior analysis.
- Select the type of heatmap to use (click, scroll, move).
- Integrate heatmap tracking code into the website.
- Monitor user interaction data over a specified period.
- Analyze the heatmap data for patterns in user engagement.
- Identify areas of the website that require optimization.
- Prioritize changes based on potential impact on conversions.
- Implement design changes based on heatmap insights.
- Conduct follow-up testing to evaluate the effectiveness of changes.
Consejos profesionales
- Layer heatmaps with user session recordings to connect quantitative data with qualitative behaviors for deeper understanding of user interactions.
- Segment heatmap data based on user demographics or traffic sources to discern variations in behavior patterns and tailor strategies effectively.
- Integrate A/B testing results with heatmap findings, allowing for more informed decisions on design changes and their direct impact on engagement metrics.
Leer y comparar varias metodologías, recomendamos el
> Amplio repositorio de metodologías <
junto con otras más de 400 metodologías.
Sus comentarios sobre esta metodología o información adicional son bienvenidos en la dirección sección de comentarios ↓ , así como cualquier idea o enlace relacionado con la ingeniería.
Contexto histórico
1986
(si se desconoce la fecha o no es relevante, por ejemplo "mecánica de fluidos", se ofrece una estimación redondeada de su notable aparición)
Publicaciones relacionadas
Calculadora de METS a calorías
Metaanálisis
Asignación de mensajes
Diagramas de modelos mentales
Fuerzas de empuje y tracción máximas admisibles
Planificación de necesidades de material (MRP)