Gantt Charts

Gantt Charts

Gantt Charts

Objetivo:

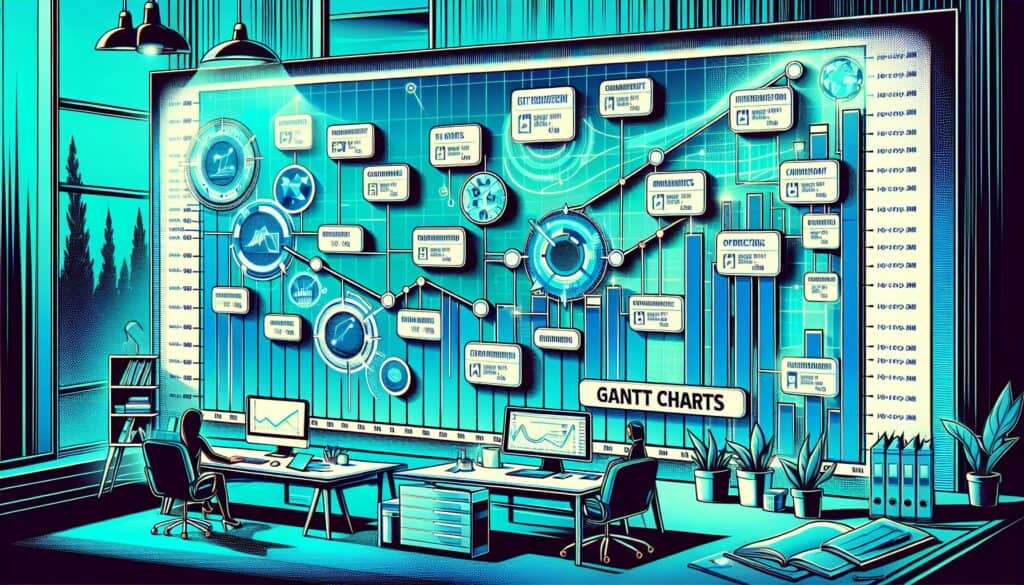
To visually represent a project schedule, showing tasks, their durations, start and end dates, dependencies, and overall project timeline.

Cómo se utiliza:

Ventajas

Contras

Categorías:

Ideal para:

Gantt charts find wide-ranging applications across industries such as construction, software development, manufacturing, and event planning, providing a structured approach to managing projects of varying scales. Often utilized in the planning phase, these charts are particularly effective when teams are determining timelines and task sequences, allowing project managers and stakeholders to allocate resources efficiently. The clarity gained from visualizing tasks alongside dependencies enables teams to identify potential bottlenecks early in the project timeline, facilitating timely adjustments. In engineering fields, where product development cycles may include prototyping, testing, and iteration, Gantt charts serve to outline each phase distinctly, advancing collaboration among cross-functional teams by promoting transparency in progress tracking. Participants in this methodology typically include project managers, team leads, and departmental stakeholders, who contribute to delineating task responsibilities and milestones. As projects progress, updates to the Gantt chart can reflect real-time developments, which maintains an accurate representation of the project’s status and fosters better communication across diverse teams. This adaptability makes Gantt charts especially beneficial in environments where tasks are interdependent and where stakeholder approval at various stages is required, as it allows for quick visual references during meetings and updates.

Pasos clave de esta metodología

  1. Identify all tasks required for project completion.
  2. Establish the sequence of tasks and identify dependencies.
  3. Determine the duration of each task.
  4. Assign resources to each task as needed.
  5. Create a timeline that incorporates all tasks and dependencies.
  6. Draw the Gantt chart reflecting task durations and dependencies.
  7. Regularly update the Gantt chart to reflect project progress.
  8. Review and adjust timelines and resources as project evolves.

Consejos profesionales

  • Integrate regular updates to the Gantt chart as project progresses, reflecting real-time changes in task durations and dependencies for accuracy.
  • Utilice código de colores to distinguish between various phases, teams, or task types, enhancing visual comprehension and prioritization.
  • Incorporate buffer times for critical tasks to mitigate risks of delays, which will aid in managing stakeholder expectations effectively.

Leer y comparar varias metodologías, recomendamos el

> Amplio repositorio de metodologías  <
junto con otras más de 400 metodologías.

Sus comentarios sobre esta metodología o información adicional son bienvenidos en la dirección sección de comentarios ↓ , así como cualquier idea o enlace relacionado con la ingeniería.

Historical Context

(if date is unknown or not relevant, e.g. "fluid mechanics", a rounded estimation of its notable emergence is provided)

Deja una respuesta

Tu dirección de correo electrónico no será publicada. Los campos obligatorios están marcados con *

Publicaciones relacionadas

Scroll al inicio