지속적인 개선, 지속가능성을 위한 디자인, 능률, 인간 공학, 린 제조, 프로세스 개선, 프로세스 매핑, 가치 흐름 맵핑, 폐기물 감축
목적:
작업 공간이나 프로세스 내에서 사람, 자재 또는 정보의 물리적 흐름을 시각화하여 불필요한 동작과 운송을 파악하고 줄이는 것.
사용 방법:
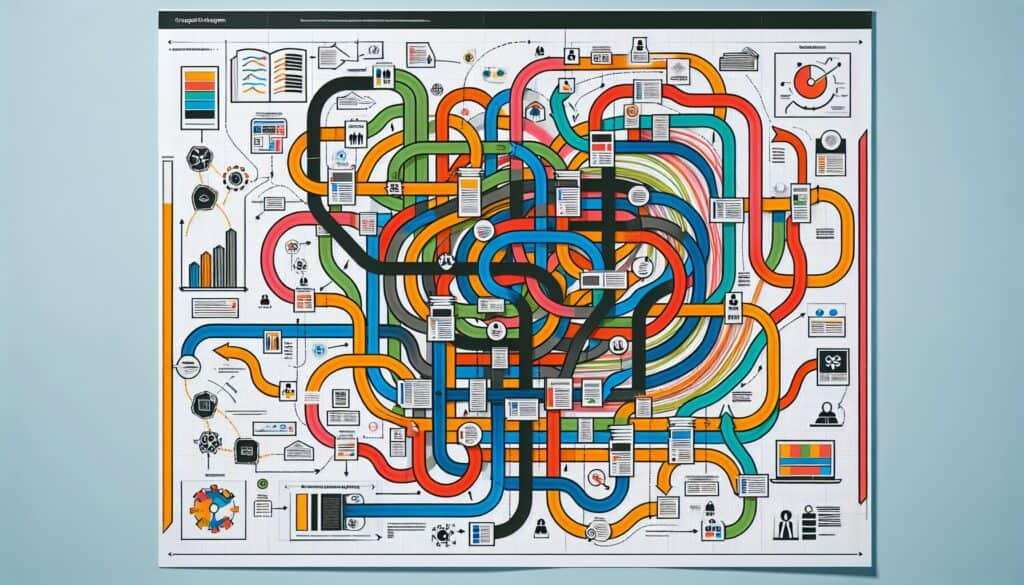
평면도나 프로세스 맵에서 물건이나 사람의 이동 경로를 따라 연속적으로 그린 선입니다. 마치 스파게티처럼 얽힌 이 선들은 과도한 이동 거리, 되돌아가는 길, 불필요한 움직임과 같은 비효율적인 부분을 보여줍니다.
장점
비효율적인 동작을 간단하고 시각적으로 파악할 수 있는 방법; 프로세스 비효율성에 대한 의사소통을 촉진합니다; 보다 효율적인 레이아웃 설계를 지원합니다; 직원들이 프로세스 개선에 참여하도록 유도합니다.
단점
복잡한 프로세스나 여러 항목/인원의 경우 생성하는 데 시간이 많이 소요될 수 있습니다. 주로 물리적 움직임에 초점을 맞추므로 다른 유형의 낭비를 포착하지 못할 수 있습니다. 정확도는 세심한 관찰에 달려 있습니다.
카테고리:
인간 공학, 린 시그마, 조작, 문제 해결
다음과 같은 경우에 가장 적합합니다:
제품, 자재 또는 사람이 이동한 경로를 시각적으로 매핑하여 낭비되는 이동 및 운송을 식별하고 제거합니다.
Spaghetti Diagrams are particularly useful in various sectors, such as manufacturing, healthcare, and logistics, where the physical movement of items or personnel is frequent and critical. In manufacturing settings, these diagrams can ensure that assembly lines are designed to minimize the distance traveled by workers and materials, thus enhancing production efficiency. In healthcare, analyzing patient and staff movements through facility spaces can lead to improved layouts that promote better patient care and reduce wait times. During the project planning phase, team members including engineers, project managers, and process improvement specialists can collaborate to create these diagrams, using tools like floor plans or process maps to visualize current workflows. This iterative approach not only identifies bottlenecks and redundancies but also encourages staff to participate actively by sharing their insights on day-to-day operations, which can lead to a sense of ownership over the process improvements. Historically, companies such as Toyota have effectively utilized Spaghetti Diagrams as part of Lean methodologies to eliminate waste, demonstrating the practical application within Lean Six Sigma frameworks. Adopting this methodology can also be advantageous when exploring new facility designs, as it provides a baseline for measuring the effects of any changes made.
이 방법론의 주요 단계
분석할 영역을 선택하고 정확한 평면도 또는 공정도를 얻으십시오.
해당 영역 내에서 물건이나 사람이 실제로 이동한 경로를 추적하십시오.
움직임을 나타낼 때는 연속적인 선을 사용하여 그려진 경로가 명확하게 보이도록 하십시오.
과도한 이동, 되돌아가기 또는 불필요한 상호 작용이 발생하는 영역을 찾아보세요.
프로세스를 간소화하거나 재설계할 수 있는 구체적인 위치를 파악하십시오.
이해관계자들과 소통하여 관찰된 패턴에 대해 논의하고 협력적인 해결책을 모색하십시오.
불필요한 동작을 최소화하기 위해 다른 배치 또는 프로세스를 고려하십시오.
변경 사항을 실행하고 추가 분석을 통해 그 효과를 모니터링하십시오.
프로 팁
스파게티 다이어그램과 함께 정량적 지표를 통합하여 동작 효율성과 성과 목표 간의 상관관계를 파악하고 데이터 기반 관점을 제공합니다.
팀 워크숍을 진행하여 스파게티 다이어그램을 공동으로 작성하고 분석함으로써, 다양한 관점이 비효율성을 파악하는 데 기여하도록 합니다.
스파게티 다이어그램 분석 결과를 바탕으로 레이아웃 디자인을 반복적으로 개선하고, 시뮬레이션 도구를 활용하여 구현 전에 변경 사항을 시각화함으로써 더 나은 의사결정을 내릴 수 있도록 지원합니다.