브레인스토밍, 지속적인 개선, 린 제조, 문제 해결 기법, 프로세스 개선, 품질 관리, 근본 원인 분석, 식스 시그마
목적:
문제의 근본 원인을 파악하는 도구.
사용 방법:
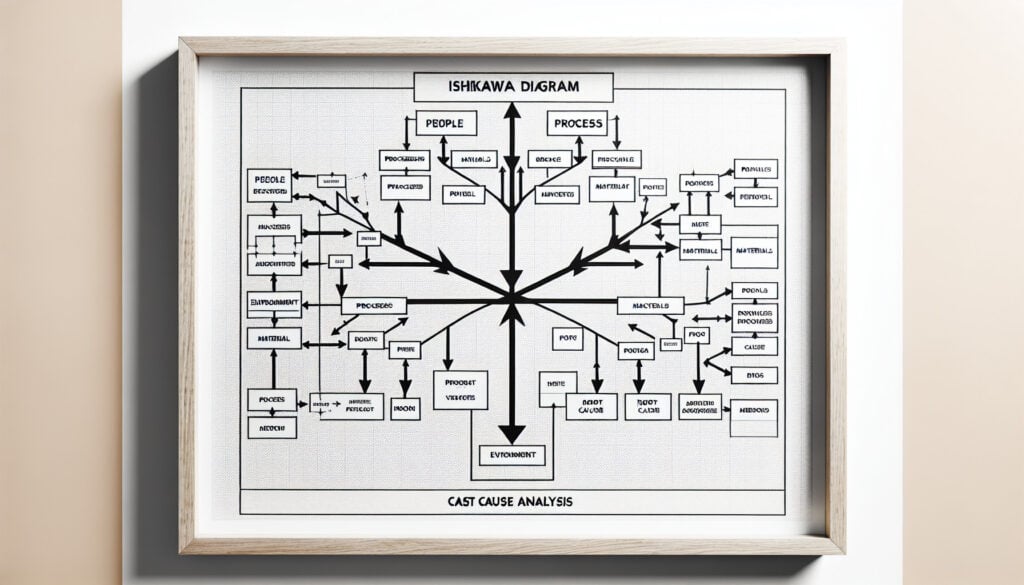
일명 어골도 또는 원인-결과도라고도 불리는 이 도표는 문제의 잠재적 원인을 분류하여 근본 원인을 파악하는 데 사용되는 시각화 도구입니다. 원인은 일반적으로 사람, 방법, 기계, 재료, 측정, 환경과 같은 주요 범주로 분류됩니다.
장점
간단하고 이해하기 쉬우며, 문제의 증상뿐 아니라 근본 원인을 파악하는 데 도움이 됩니다.
단점
주관적일 수 있으며 참여자의 지식 수준에 따라 달라질 수 있습니다. 여러 가지 원인이 복합적으로 작용하는 복잡한 문제에는 적합하지 않을 수 있습니다.
카테고리:
문제 해결, 품질
다음과 같은 경우에 가장 적합합니다:
팀 브레인스토밍을 통해 문제의 근본 원인을 파악하는 것.
The Ishikawa Diagram is widely utilized in various industries such as manufacturing, healthcare, software development, and service sectors, serving as an effective tool during phases of problem-solving or quality improvement initiatives. Typically employed in team brainstorming sessions, this methodology draws participation from diverse stakeholders including engineers, quality assurance personnel, project managers, and frontline employees, enabling a comprehensive examination of issues from multiple angles. Each category within the diagram, such as people, processes, machinery, materials, measurements, and environment, encourages participants to think critically about all potential causes that could contribute to a problem, facilitating a systematic approach to identifying root causes rather than just addressing surface-level symptoms. With its straightforward visual format, the diagram promotes collaborative discussions and enhances understanding among team members, making it easier to communicate complex issues and fostering a shared commitment to developing actionable solutions. Industries often apply this methodology in contexts like Six Sigma projects or Lean initiatives, where continuous improvement is crucial, demonstrating its versatility across different project types and goals. In practice, this tool can lead to more sustainable outcomes by encouraging teams to implement corrective measures that tackle the actual underlying issues rather than simply providing temporary fixes. Engaging in this exercise not only aids in troubleshooting but also strengthens the team’s problem-solving capabilities for future challenges.
이 방법론의 주요 단계
문제를 명확하고 간결하게 정의하십시오.
문제 설명을 위한 상자와 가로선을 추가하여 피시본 다이어그램을 그리세요.
주요 원인 범주를 파악하고 이를 도표의 중심축에서 가지처럼 뻗어나가도록 추가하십시오.
각 범주 내에서 잠재적인 원인을 브레인스토밍하고 이를 하위 분기로 추가하세요.
잠재적 영향과 발생 가능성을 논의하여 가장 중요한 원인들을 분석하십시오.
추가 조사 또는 조치가 필요한 근본 원인을 선택하십시오.
파악된 근본 원인을 해결하기 위한 실행 계획을 수립하십시오.
프로 팁
다양한 관점을 확보하고 분석의 깊이를 높이며 숨겨진 원인을 밝혀내기 위해 여러 부서의 전문가들로 구성된 팀을 참여시키십시오.
새로운 데이터가 나올 때마다 도표를 정기적으로 검토하고 업데이트하여 문제에 대한 현재의 이해를 반영하도록 하십시오.
실시간 협업을 위해 디지털 도구를 활용하여 팀 구성원들이 비동기적으로 의견을 제시할 수 있도록 함으로써 토론을 더욱 풍성하게 만드세요.