
V&V, विनिर्माण और गुणवत्ता में एक-तरफ़ा दोषों और बाहरी तत्वों को संभालना
एक विमान अचानक नीचे की ओर इशारा कर रहा है, एक कार का हिस्सा राजमार्ग पर उड़ रहा है, एक ब्लेड एक में ब्रेक लगा रहा है
एक विमान अचानक नीचे की ओर इशारा कर रहा है, एक कार का हिस्सा राजमार्ग पर उड़ रहा है, एक ब्लेड एक में ब्रेक लगा रहा है

This week: MRI, sex differences, fetal brain, meta-analysis, fractal architecture, quantum computing, self-pruning, computational efficiency, Welded body, battery housing, welding
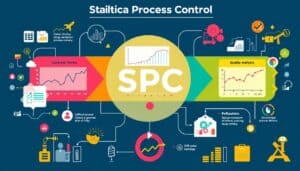
Statistical Process Control (SPC) is key in quality management. It gives real-time insights to keep process performance and product quality