A set of fundamental, graphical, and statistical tools for quality control and improvement.
- المنهجيات: العملاء والتسويق, الاقتصاد, لين سيجما, تصنيع, إدارة المشاريع, الجودة
7 أدوات مراقبة الجودة
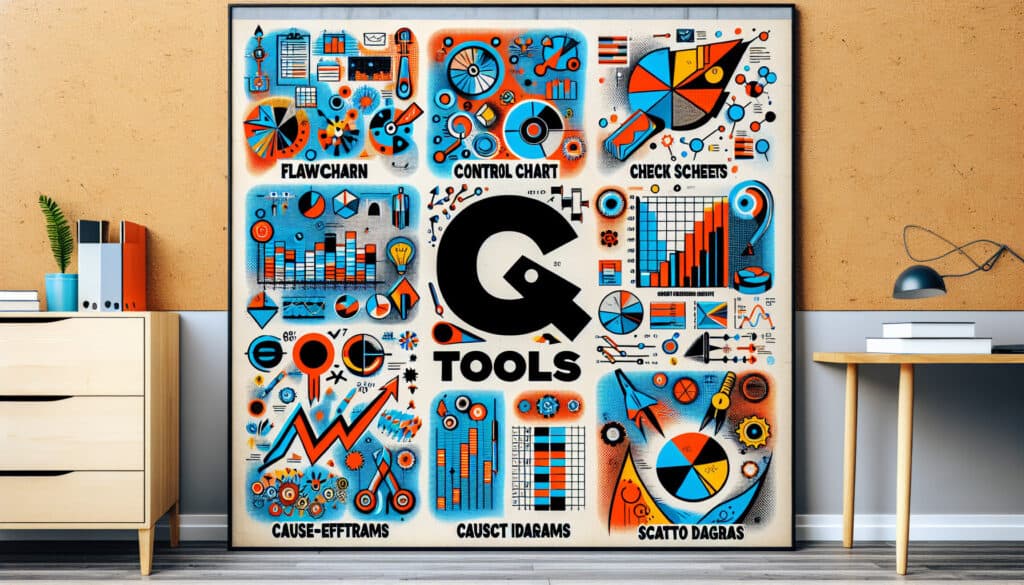
7 أدوات مراقبة الجودة
- التحسين المستمر, مخطط التحكم, Pareto Chart, تقنيات حل المشكلات, تحسين العمليات, ضمان الجودة, مراقبة الجودة, إدارة الجودة, نظام إدارة الجودة (QMS)
الهدف:
كيفية استخدامه:
- These tools are used to collect, analyze, and interpret data to solve quality-related problems. They include tools like Pareto charts, fishbone diagrams, control charts, and histograms.
الايجابيات
- Simple to use, provides a structured approach to problem-solving, and facilitates data-driven decision-making.
سلبيات
- May not be sufficient for complex statistical analysis, and their effectiveness depends on correct application and interpretation.
الفئات:
- لين سيجما, تصنيع, حل المشكلات, الجودة
الأفضل لـ
- Identifying and resolving most quality problems in a production environment.
The 7 QC Tools methodology finds applications across various industries such as manufacturing, healthcare, and service sectors, enabling teams to systematically address and resolve quality issues by leveraging practical data analysis techniques. In a manufacturing context, for instance, a team may apply Pareto charts to identify the most frequent defects, directing efforts toward the most significant problems that impact production efficiency. Fishbone diagrams can be utilized during brainstorming sessions to uncover root causes of quality failures, facilitating collaborative problem-solving among cross-functional teams including engineers, quality assurance, and production staff. Control charts are integral in monitoring processes over time, helping practitioners to maintain quality standards by identifying variances that may signal underlying issues. Histogram analyses support the visualization of data distribution, revealing patterns about production consistency and potential areas for improvement. Typically, these methodologies are employed in the quality improvement phase of projects, often initiated by quality managers or team leaders who engage stakeholders throughout the organization. Training sessions on these tools equip participants with the necessary skills to analyze quality issues in real-time, enabling rapid decision-making based on empirical evidence rather than assumptions. Using the 7 QC Tools promotes a culture of continuous improvement, encourages open communication, and empowers teams to take ownership of quality enhancement initiatives.
الخطوات الرئيسية لهذه المنهجية
- Identify the quality problem to focus on.
- Utilize a Pareto chart to prioritize issues based on frequency or impact.
- Employ a fishbone diagram to analyze root causes of the identified problem.
- Use a scatter diagram to identify relationships between variables.
- Implement control charts to monitor process performance over time.
- Create histograms to visualize the distribution of data related to the issue.
- Conduct a failure mode and effects analysis (FMEA) to evaluate potential failures.
- Use a check sheet to collect qualitative and quantitative data during analysis.
نصائح للمحترفين
- Integrate real-time data monitoring with control charts to identify trends as they develop, enabling proactive quality management.
- Utilize multi-dimensional fishbone diagrams to dissect root causes from various perspectives, enhancing collaborative analysis among cross-functional teams.
- Combine Pareto analysis with predictive analytics to not only identify major issues but also forecast potential future problems based on historical data patterns.
لقراءة عدة منهجيات ومقارنتها, نوصي باستخدام
> مستودع المنهجيات الشامل <
مع أكثر من 400 منهجية أخرى.
نرحب بتعليقاتكم على هذه المنهجية أو المعلومات الإضافية على قسم التعليقات أدناه ↓، وكذلك أي أفكار أو روابط متعلقة بالهندسة.
السياق التاريخي


1962
1970
1972
1980
1980
1986
1986
1960
1963
1970
1980
1980
1980
1986
1987


(إذا كان التاريخ غير معروف أو غير ذي صلة، على سبيل المثال "ميكانيكا الموائع"، يتم تقديم تقدير تقريبي لظهوره الملحوظ)
منشورات ذات صلة
استبيانات الانزعاج العضلي الهيكلي
الاختبار متعدد المتغيرات (MVT)
تحليل الانحدار المتعدد
أنظمة التقاط الحركة
طريقة MoSCoW
اختبار متوسط المزاج